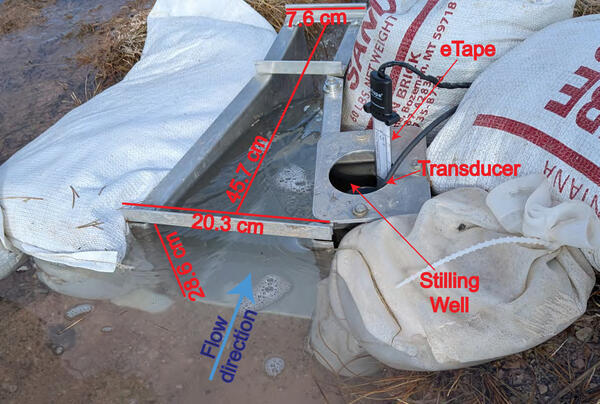
U.S. flag

An official website of the United States government

Images

Volcano Science Center images.

Filter Total Items: 534
Photoscans and computed tomography of sediment cores from Henrys Lake, Idaho

Transect of sediment cores from Henrys Lake, Idaho. (a) High‐resolution photoscans and computed tomography (CT) of each core correspond to the location tie line. White line on CT represents gamma ray attenuation bulk density (g/cc). Mapped facies are right of each correspondent core. Shades of gray represent background sedimentation and the event deposit by orange.

Transect of sediment cores from Henrys Lake, Idaho. (a) High‐resolution photoscans and computed tomography (CT) of each core correspond to the location tie line. White line on CT represents gamma ray attenuation bulk density (g/cc). Mapped facies are right of each correspondent core. Shades of gray represent background sedimentation and the event deposit by orange.

Hazy view of a crater wall with some vegetation in the foreground and a shield-shaped mountain in the background
Hazy conditions caused by sulfur dioxide emissions from Kīlauea, Hawai‘i

Hazy conditions caused by sulfur dioxide (SO2) emissions from Halema‘uma‘u crater, Kīlauea, Hawai‘i.  USGS photo by Jennifer Lewicki, December 25, 2024.

Desolate volcanic crater of gray/brown rick under a blue sky with a sloping mountain in the background
Kīlauea summit caldera from B1 camera on December 20, 2024

View of Kaluapele (Kīlauea's summit caldera) from the B1 webcam on December 20, 2024, just before the onset of the episodic lava fountaining eruption on December 23.

View of Kaluapele (Kīlauea's summit caldera) from the B1 webcam on December 20, 2024, just before the onset of the episodic lava fountaining eruption on December 23.

Three-panel figure showing scrubland vegetation (left), conifers (center), and lodgepole pines (right)
Modern vegetation on different geological substrates in Yellowstone

Modern vegetation on different geological substrates in Yellowstone.  Left: steppe/grassland on glacial clay found in places like Lamar and Hayden Valleys.  Center: Mixed conifer forest in the Absaroka andesite volcanic field in the eastern part of Yellowstone National Park.  Right: Lodgepole pine forest on Central Plateau rhyolite (hydrothermal grass

Modern vegetation on different geological substrates in Yellowstone.  Left: steppe/grassland on glacial clay found in places like Lamar and Hayden Valleys.  Center: Mixed conifer forest in the Absaroka andesite volcanic field in the eastern part of Yellowstone National Park.  Right: Lodgepole pine forest on Central Plateau rhyolite (hydrothermal grass

Vegetation history based on pollen records from three small lakes on different geological substrates in Yellowstone National
Vegetation history based on pollen records from three small lakes on different geological substrates in Yellowstone National Park

Vegetation history based on pollen records from three small lakes on different geological substrates in Yellowstone National Park.   Blue is open vegetation, light green is parkland, dark green is forest.  Top plot is from Slough Creek Pond, in a present grassland area dominated by glacial and lake sediment in the northeast part of Yellowstone Nationa

View of Mount Adams from a distance, scientists installing a monitoring station, and map where earthquakes have occurred.
Update on seismic activity at Mount Adams from September 2024 to early November 2024

Volcanoes tend to have seismicity that waxes and wanes over time. That’s considered normal and not necessarily a cause for concern. Let’s check on Mount Adams to see what USGS scientists are doing to learn more about its recent earthquake activity and what it could mean for this Cascade Range volcano.

Volcanoes tend to have seismicity that waxes and wanes over time. That’s considered normal and not necessarily a cause for concern. Let’s check on Mount Adams to see what USGS scientists are doing to learn more about its recent earthquake activity and what it could mean for this Cascade Range volcano.

Plot showing frequency of rhyolite eruptions in the Yellowstone region over the past 1.3 million years
Schematic summary of rhyolite eruptions in the Yellowstone Plateau volcanic field over the past 1.3 million years

Schematic summary of rhyolite eruptions in the Yellowstone Plateau volcanic field over the past 1.3 million years. Smaller rhyolite eruptions are known intracaldera eruptions, meaning they occurred within existing caldera structures. Additional rhyolite eruptions that occurred outside the caldera are not included in the figure.

Schematic summary of rhyolite eruptions in the Yellowstone Plateau volcanic field over the past 1.3 million years. Smaller rhyolite eruptions are known intracaldera eruptions, meaning they occurred within existing caldera structures. Additional rhyolite eruptions that occurred outside the caldera are not included in the figure.

Graphic showing how InSAR detects ground deformation

Graphic showing how InSAR detects ground deformation by measuring changes in the signal that bounces off the Earth. Figure by the EarthScope Consortium.

Bathymetric map of the West Thumb Basin, Yellowstone National Park

Bathymetric map of the West Thumb Basin showing numerous mapped active or inactive hydrothermal vent sites (small white circles) and sampled hot springs (white stars or larger white circles) and sediment cores (yellow diamonds).  The white-black line represents the 160,000-year-old West Thumb Caldera margin.  West Thumb Geyser Basin is near the southern en

Bathymetric map of the West Thumb Basin showing numerous mapped active or inactive hydrothermal vent sites (small white circles) and sampled hot springs (white stars or larger white circles) and sediment cores (yellow diamonds).  The white-black line represents the 160,000-year-old West Thumb Caldera margin.  West Thumb Geyser Basin is near the southern en

A brass-disk benchmark set in the top of a concrete post.  Mark is stamped "C9 1923 7337.580"
Benchmark C9, near Apollinaris Spring in Yellowstone National Park

Benchmark C9, installed by the US Coast and Geodetic Survey (now the National Geodetic Survey) in 1923 near Apollinaris Spring in Yellowstone National Park.  The number stamped into the mark, “7337.580,” is the elevation in feet that was determined by surveys the year the benchmark was established.  USGS photo by Michael Poland, September 4, 2024.

Benchmark C9, installed by the US Coast and Geodetic Survey (now the National Geodetic Survey) in 1923 near Apollinaris Spring in Yellowstone National Park.  The number stamped into the mark, “7337.580,” is the elevation in feet that was determined by surveys the year the benchmark was established.  USGS photo by Michael Poland, September 4, 2024.

Marsh in the foreground, treed hill in the background. Steam vent at base of hill. Blue sky above.
New steam vent that formed in 2024 near Nymph Lake, Yellowstone National Park

New steam vent at the base of a hill north of Nymph Lake, west of the highway and between Norris Geyser Basin and Roaring Mountain. USGS photo by Mike Poland, September 1, 2024.

Dead lodgepole pine trees along the shoreline of a small lake.  Live trees are present away from the shore.
Dead trees along the edge of Nuphar Lake, Yellowstone National Park, in summer 2024

Photo of dead trees along the edge of Nuphar Lake.  The white staining at the base of the trees is a telltale sign that the trees were immersed in thermal water containing silica.  USGS photo by Mike Poland, September 1, 2024.

Marsh in foreground, tree-covered hill in background with a steam vent at it's base, all under blue sky
new thermal feature that formed in 2024 near Nymph Lake, Yellowstone National Park

Looking south from near a pullout along the Mammoth to Norris road just north of the Nymph Lake overlook. On the other side of the marsh is a tree-covered rhyolite lava flow, and at the base of the flow is a new thermal feature marked by a plume of steam and that formed in early August 2024.   Photo by Mike Poland, USGS, September 1, 2024.

Looking south from near a pullout along the Mammoth to Norris road just north of the Nymph Lake overlook. On the other side of the marsh is a tree-covered rhyolite lava flow, and at the base of the flow is a new thermal feature marked by a plume of steam and that formed in early August 2024.   Photo by Mike Poland, USGS, September 1, 2024.

Satellite images of a small lake in April and August 2024. The lake is surrounded by trees and, on one side, a geyser basin.
Satellite images of Nupahr Lake, Norris Geyser Basin, in 2024

High-resolution satellite images of Norris Geyser Basin showing the area of Porcelain Basin and Nuphar Lake (both images cover the same area).  In the left image, acquired on April 2, 2024, springs on Porcelain Terrace are full of water, and warm hydrothermal water is flowing into Nuphar Lake from the area circled in yellow.  This warm water kept the north

High-resolution satellite images of Norris Geyser Basin showing the area of Porcelain Basin and Nuphar Lake (both images cover the same area).  In the left image, acquired on April 2, 2024, springs on Porcelain Terrace are full of water, and warm hydrothermal water is flowing into Nuphar Lake from the area circled in yellow.  This warm water kept the north

A river winds through a meadow at sunset, with pink clouds in the sky.  Trees are in the background.
Gibbon River near Norris Geyser Basin in Yellowstone National Park

Gibbon River near Norris Geyser Basin in Yellowstone National Park at sunset.  USGS Photo by Mike Poland, August 28, 2024.

Geologist on a hillside within a barren landscape of reddish and pale rocks
Geologist examining Lava Creek Tuff ash fall beds near Shell, Wyoming

Professor C.J.N. Wilson, FRS, pays due homage to the Lava Creek Tuff ashfall bed in a basin just east of Shell, Wyoming. Photo by Madison Myers, Montana State University, August 9, 2024.

Plot of size versus annual probability for hydrothermal explosion craters in Yellowstone National Park

Plot of size versus annual probability for hydrothermal explosion craters in Yellowstone National Park. The line is a model based on the energy required to form a crater of a specific size, and it is fit to known hydrothermal explosion craters in Yellowstone National Park.

Fist sized sample of rock, black in color with white flecks
Hand sample of the Mount Jackson vitrophyre

A clean hand sample of the Mount Jackson vitrophyre. This sample has a black, glassy groundmass with large (1–3 mm, or a small fraction of an inch), white phenocrysts suspended in the glass. Photo by Liv Wheeler, Montana State University, August 2024.

A clean hand sample of the Mount Jackson vitrophyre. This sample has a black, glassy groundmass with large (1–3 mm, or a small fraction of an inch), white phenocrysts suspended in the glass. Photo by Liv Wheeler, Montana State University, August 2024.

Photomicrograph showing water distribution in a quartz-hosted embayment, with greater concentrations at the embayment mouth. Includes a plot showing that the temperature in which the water circulated must have been about 500 degrees Celsius.
Water distribution in a quartz-hosted embayment from the Mesa Falls Tuff

(A) Water distribution in a quartz-hosted embayment measured with synchrotron Fourier Transform Infrared spectroscopy. Warmer colors indicate higher concentrations of water.  Dashed line shows a transect of water content that is modeled in panel (B) to indicate that the emplacement temperature of the ash flow deposit must have been about 500 °C (930 °F).

(A) Water distribution in a quartz-hosted embayment measured with synchrotron Fourier Transform Infrared spectroscopy. Warmer colors indicate higher concentrations of water.  Dashed line shows a transect of water content that is modeled in panel (B) to indicate that the emplacement temperature of the ash flow deposit must have been about 500 °C (930 °F).

Graph showing explosions recorded at Black Diamond Pool in Biscuit Basin, Yellowstone National Park, during 2006 through 2016

Graph showing explosions recorded at Black Diamond Pool in Biscuit Basin, Yellowstone National Park, during 2006 through 2016. Confirmed events refer to eruptions that were witnessed, recorded by temperature loggers, or inferred from their aftermath. Unconfirmed events refer to eruptions that were questionable or might have been misattributed to Black Diamond.

Graph showing explosions recorded at Black Diamond Pool in Biscuit Basin, Yellowstone National Park, during 2006 through 2016. Confirmed events refer to eruptions that were witnessed, recorded by temperature loggers, or inferred from their aftermath. Unconfirmed events refer to eruptions that were questionable or might have been misattributed to Black Diamond.

Was this page helpful?