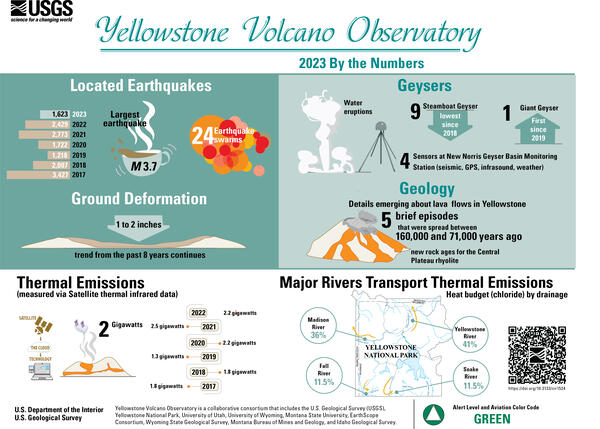
U.S. flag

An official website of the United States government

Images

Volcano Science Center images.

Filter Total Items: 540
Plot showing the total geothermal radiant power output from Yellowstone’s thermal areas based on Landsat 8 and Landsat 9 thermal infrared images from 2014 to 2024
Total geothermal radiant power output from Yellowstone thermal areas based on Landsat 8 and Landsat 9 thermal infrared images from 2014 to 2024

Plot showing the total geothermal radiant power output from Yellowstone’s thermal areas based on Landsat 8 and Landsat 9 thermal infrared images from 2014 to 2024.  Only data from clear, nighttime, wintertime (November through March) dates were used.  The results indicate that there has been no significant change over the last 10 years.

History of travertine deposition in Yellowstone caldera and correlation with past climate conditions

History of travertine deposition in Yellowstone caldera and correlation with past climate conditions. a) The age of travertine samples (based on the U-230Th geochronometer) from Old Hillside Springs, Hillside Springs, North Hillside Springs, and Morning Glory in Upper Geyser Basin and from Firehole Lake in Lower Geyser Basin.

History of travertine deposition in Yellowstone caldera and correlation with past climate conditions. a) The age of travertine samples (based on the U-230Th geochronometer) from Old Hillside Springs, Hillside Springs, North Hillside Springs, and Morning Glory in Upper Geyser Basin and from Firehole Lake in Lower Geyser Basin.

Color photograph of volcano scientist accepting an award
Ed Brown, center, receiving an Information, Management and Technology award

Ed Brown, center, receiving an Information, Management and Technology award from the Office of the Associate Chief Information Officer for his leadership and commitment to the USGS. The award was presented by Alan Wiser (left) and Tim Quinn (right) at the Information Technology Exchange Meeting in April 2024. 

Ed Brown, center, receiving an Information, Management and Technology award from the Office of the Associate Chief Information Officer for his leadership and commitment to the USGS. The award was presented by Alan Wiser (left) and Tim Quinn (right) at the Information Technology Exchange Meeting in April 2024. 

Text says Mount St. Helens, Land of Transformation
Mount St. Helens: Land of Transformation

Mount St. Helens: Land of Transformation video shows the changes to the landscape from before the May 18, 1980 eruption to today (2024).

Plots showing the number of water samples collected over time (top) and by location (bottom) in the Yellowstone region since the late 1800s

Plots showing the number of water samples collected over time (top) and by location (bottom) in the Yellowstone region since the late 1800s. Yellowstone’s archive of water-chemistry research data is a mosaic of scientific progress, built with the work of hundreds of people over more than a century and still growing today.

High-resolution satellite images of Norris Geyser Basin showing the area of Porcelain Basin and Nuphar Lake in April 2024

High-resolution satellite images of Norris Geyser Basin showing the area of Porcelain Basin and Nuphar Lake in April 2024.  In the left image, acquired on April 2, 2024, springs on Porcelain Terrace are full of water, and warm hydrothermal water is flowing into Nuphar Lake, keeping the north part of the lake free of ice.  Boardwalks in the area appear as w

High-resolution satellite images of Norris Geyser Basin showing the area of Porcelain Basin and Nuphar Lake in April 2024.  In the left image, acquired on April 2, 2024, springs on Porcelain Terrace are full of water, and warm hydrothermal water is flowing into Nuphar Lake, keeping the north part of the lake free of ice.  Boardwalks in the area appear as w

USGS Employees high five students participating in an outdoor lahar evacuation drill outside their school
Lahar Evacuation Drill

During the March 21, 2024 lahar evacuation drills, thousands of students walked to the Washington State Fairgrounds in Puyallup, Washington to practice evacuating from a lahar generated by Mount Rainier. A lahar, or volcanic mudflow, could reach this area in about 3 hours.

During the March 21, 2024 lahar evacuation drills, thousands of students walked to the Washington State Fairgrounds in Puyallup, Washington to practice evacuating from a lahar generated by Mount Rainier. A lahar, or volcanic mudflow, could reach this area in about 3 hours.

bull elk with large antlers walking through heavy snow
Bull elk wintering in Yellowstone National Park

Photo of a bull elk wintering in Yellowstone National Park. Photo by Elizabeth Mordensky, March 5, 2024.

Melt inclusions in a quartz crystal from the Huckleberry Ridge Tuff

Melt inclusions (<50 micrometers in diameter) in a quartz crystal from the Huckleberry Ridge Tuff, erupted 2.1 million years ago. Photomicrograph taken by Behnaz Hosseini at Montana State University.

Melt inclusions (<50 micrometers in diameter) in a quartz crystal from the Huckleberry Ridge Tuff, erupted 2.1 million years ago. Photomicrograph taken by Behnaz Hosseini at Montana State University.

Illustration of the crystal growth process that leads to melt inclusion entrapment

Illustration of the crystal growth process that leads to melt inclusion entrapment. (a) A crystal (gray area) nucleates and grows. (b) As the magma cools, the crystal corners will grow more efficiently than crystal edges. (c) This growth process will lead to the entrapment of surrounding melt (orange area).

Illustration of the crystal growth process that leads to melt inclusion entrapment. (a) A crystal (gray area) nucleates and grows. (b) As the magma cools, the crystal corners will grow more efficiently than crystal edges. (c) This growth process will lead to the entrapment of surrounding melt (orange area).

Schematic of the Huckleberry Ridge Tuff magma storage configuration

Schematic of the Huckleberry Ridge Tuff magma storage configuration, consisting of discrete batches of magma. Analyzing the compositions of melt inclusions can help paint this type of big picture of the magmatic system. Figure modified from Myers et al. (2016).

Schematic of the Huckleberry Ridge Tuff magma storage configuration, consisting of discrete batches of magma. Analyzing the compositions of melt inclusions can help paint this type of big picture of the magmatic system. Figure modified from Myers et al. (2016).

Map of the locations of water samples collected in and around Yellowstone National Park, 1883-2021
Histogram of Yellowstone earthquakes during 1973-2023

Histogram showing the number of earthquakes per 3-month period (quarter) in the Yellowstone region during 1973–2023.  Red bars represent all earthquakes located in the area, and blue bars indicate swarm seismicity.

Histogram showing the number of earthquakes per 3-month period (quarter) in the Yellowstone region during 1973–2023.  Red bars represent all earthquakes located in the area, and blue bars indicate swarm seismicity.

Map of Yellowstone earthquakes that were located during 1973-2023

Map of Yellowstone earthquakes that were located during 1973-2023. Red circles are earthquakes located in the Yellowstone region, and blue circles indicate swarm seismicity.  The size of the circle scales with the magnitude of the earthquake.

Map of Yellowstone earthquakes that were located during 1973-2023. Red circles are earthquakes located in the Yellowstone region, and blue circles indicate swarm seismicity.  The size of the circle scales with the magnitude of the earthquake.

Vertical motion at GPS station P720, near the Slough Creek Campground in the northeast part of Yellowstone National Park
Table showing types of geothermal data and levels at which different responses are required, colored red-yellow-green according to severity
Trigger Action Response Plan for the Yellowstone River Bridge project

Trigger Action Response Plan (TARP) for the Yellowstone River Bridge replacement project.  The plan gives three levels of response for various conditions that might be encountered during drilling of bridge footings.  The level of severity is indicated by the colors, with green being least severe and red being most severe.

Trigger Action Response Plan (TARP) for the Yellowstone River Bridge replacement project.  The plan gives three levels of response for various conditions that might be encountered during drilling of bridge footings.  The level of severity is indicated by the colors, with green being least severe and red being most severe.

Map of western USA with colors indicating likelihood of hydrothermal activity
Map of areas predicted as having conditions favorable for fostering a hydrothermal system in the western United States

Map of areas predicted as having conditions favorable for fostering a hydrothermal system in the western United States.  Black dots are mapped hydrothermal systems.  From Mordensky et al., 2023 (https://www.sciencedirect.com/science/article/pii/S0375650523000160).

Map of Pacific Northwest US and Canada showing distribution of Eocene volcanic rocks with colors noting Challis volcanics
Map of Eocene igneous rocks associated with the Challis-Kamloops Belt

Map of Eocene igneous rocks associated with the Challis-Kamloops Belt. The Challis volcanics are indicated by red (extrusive) and orange (intrusive) colors.  The Absaroka volcanics are blue. Other Eocene rocks are shaded gray.  Map by Zach Lifton, Idaho Geological Survey.

Map of Eocene igneous rocks associated with the Challis-Kamloops Belt. The Challis volcanics are indicated by red (extrusive) and orange (intrusive) colors.  The Absaroka volcanics are blue. Other Eocene rocks are shaded gray.  Map by Zach Lifton, Idaho Geological Survey.

Plot of specific conductance, discharge, and temperature measured at the Yellowstone River at Corwin Springs, MT, in early-mid 2023

Plot of specific conductance, discharge, and temperature measured at the Yellowstone River at Corwin Springs, Montana, during early-mid 2023. The anomalous spikes in temperature and specific conductance on May 23, 2023, are thought to be when a large sand and bar was deposited at the site. May 23 is also the peak flow in 2023.

Hydrograph showing discharge in cubic feet per second for Corwin Springs streamgage site on the Yellowstone River, MT, spanning 1889-2023

Hydrograph showing discharge in cubic feet per second for Corwin Springs streamgage site on the Yellowstone River, MT, spanning 1889-2023.  The spike in 2022 is from the June floods of that year.

Was this page helpful?