
(A) Photomicrograph of a quartz-hosted embayment from the Mesa Falls Tuff. “MI” indicates a glassy inclusion of melt within the crystal. (B) Thickness (in centimeters) and extent of the Mesa Falls ash flow deposit (pink areas) and its source, Henrys Fork Caldera (dashed line). Figure by Kenneth Befus, University of Texas at Austin.
Images
Volcano Science Center images.
Filter Total Items: 563

Quartz-hosted embayment from the Mesa Falls Tuff
(A) Photomicrograph of a quartz-hosted embayment from the Mesa Falls Tuff. “MI” indicates a glassy inclusion of melt within the crystal. (B) Thickness (in centimeters) and extent of the Mesa Falls ash flow deposit (pink areas) and its source, Henrys Fork Caldera (dashed line). Figure by Kenneth Befus, University of Texas at Austin.

Cinder Pool, located in the southwest part of 100 Spring Plain in Norris Geyser Basin, Yellowstone National Park
Cinder Pool, located in the southwest part of 100 Spring Plain in Norris Geyser Basin, Yellowstone National ParkCinder Pool, located in the southwest part of 100 Spring Plain in Norris Geyser Basin, Yellowstone National Park. The pool was known for “cinders” made of sulfur that condensed after rising from a molten layer at the bottom of the pool, but after 2019 those cinders disappeared. Photos from June 2018 (left) and June 2023 (right) by Lauren Harrison.
Exposure of the Mount Jackson Rhyolite Series vitrophyre at Gibbon River
Exposure of the Mount Jackson Rhyolite Series vitrophyre at Gibbon RiverExposure of the Mount Jackson Rhyolite Series vitrophyre at Gibbon River. Boulders of weathered, lichen-covered rock show how easy it is to overlook these new units. Photo by Liv Wheeler, Montana State University, August 2024.

Graph showing explosions recorded at Black Diamond Pool in Biscuit Basin, Yellowstone National Park, during 2006 through 2016
Graph showing explosions recorded at Black Diamond Pool in Biscuit Basin, Yellowstone National Park, during 2006 through 2016Graph showing explosions recorded at Black Diamond Pool in Biscuit Basin, Yellowstone National Park, during 2006 through 2016. Confirmed events refer to eruptions that were witnessed, recorded by temperature loggers, or inferred from their aftermath. Unconfirmed events refer to eruptions that were questionable or might have been misattributed to Black Diamond.

Lidar hillshade maps of fault scarps that offset Pinedale glacial till along the East Gallatin-Reese Creek fault system, Yellowstone National Park
Lidar hillshade maps of fault scarps that offset Pinedale glacial till along the East Gallatin-Reese Creek fault system, Yellowstone National ParkLidar hillshade maps of fault scarps that offset Pinedale glacial till along the East Gallatin-Reese Creek fault system (EGRCFS) near Fawn Creek (A) and Panther Creek (B). Fault scarps are visible as darker lineaments in the hillshade and are marked by the black arrows. Red rectangles on inset maps show location along the EGRCFS.

Largest identified boulder displaced by the July 23, 2024, explosion from Black Diamond Pool, Yellowstone National Park
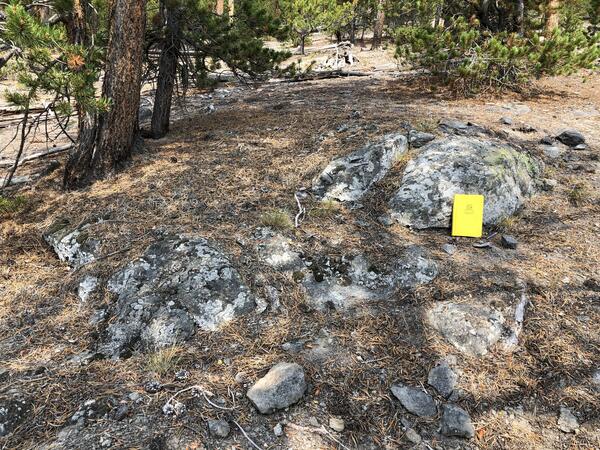
Largest identified boulder displaced by the July 23, 2024, explosion from Black Diamond Pool, Yellowstone National ParkThis boulder is the largest that is confirmed to have been part of the July 23, 2024, hydrothermal explosion from Black Diamond Pool, Biscuit Basin, Yellowstone National Park. The tape measure is 50 centimeters (20 inches) long. Black Diamond Pool and a boardwalk are in the background.
Largest identified boulder displaced by the July 23, 2024, explosion from Black Diamond Pool, Yellowstone National Park
Largest identified boulder displaced by the July 23, 2024, explosion from Black Diamond Pool, Yellowstone National ParkThis boulder is the largest that is confirmed to have been part of the July 23, 2024, hydrothermal explosion from Black Diamond Pool, Biscuit Basin, Yellowstone National Park. The tape measure is 50 centimeters (20 inches) long. Black Diamond Pool and a boardwalk are in the background.

High-resolution Planet satellite image of Biscuit Basin, Yellowstone National Park, from July 24, 2024
High-resolution Planet satellite image of Biscuit Basin, Yellowstone National Park, from July 24, 2024High-resolution Planet satellite image of Biscuit Basin, Yellowstone National Park, from July 24, 2024. The image shows changes that occurred as a result of the July 23, 2024, hydrothermal explosion from Black Diamond Pool, including deposition of material in the vicinity of the pool and a plume of discolored water in the Forehole River.
Examples of seismic noise in Yellowstone caused by people
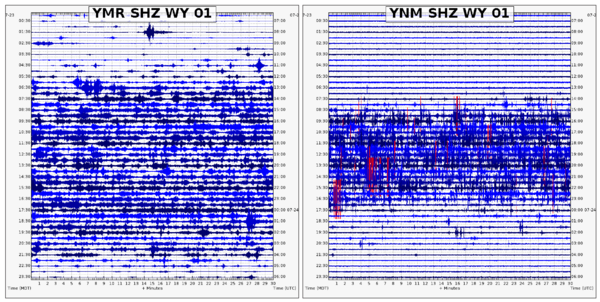
Examples of seismic noise in Yellowstone caused by peopleWebicorders of Yellowstone Seismic Network stations YMR (West Entrance road) and YNM (Norris Geyser Basin Museum) showing traffic signals (left) and visitors walking (right) during daytime hours. Both records span the entire 24-hour period of July 23, 2024, MDT.
Examples of seismic noise in Yellowstone caused by people
Examples of seismic noise in Yellowstone caused by peopleWebicorders of Yellowstone Seismic Network stations YMR (West Entrance road) and YNM (Norris Geyser Basin Museum) showing traffic signals (left) and visitors walking (right) during daytime hours. Both records span the entire 24-hour period of July 23, 2024, MDT.
Cover of the Yellowstone Volcano Observatory response plan
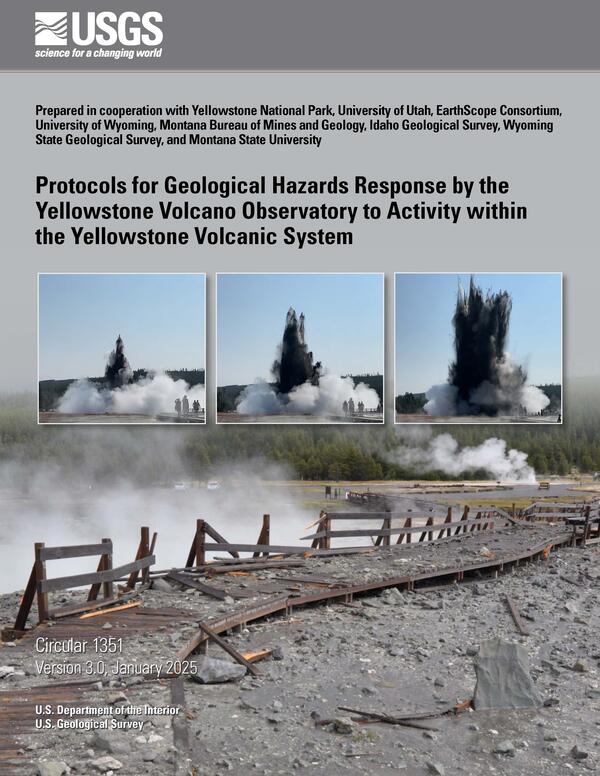
Cover of the Yellowstone Volcano Observatory response planCover of the Yellowstone Volcano Observatory response plan for geological hazards in the Yellowstone region. The report can be accessed at https://pubs.usgs.gov/circ/1351/. Cover features a photograph by Mike Poland and frame captures from a video by Juliet Su.
Cover of the Yellowstone Volcano Observatory response plan
Cover of the Yellowstone Volcano Observatory response planCover of the Yellowstone Volcano Observatory response plan for geological hazards in the Yellowstone region. The report can be accessed at https://pubs.usgs.gov/circ/1351/. Cover features a photograph by Mike Poland and frame captures from a video by Juliet Su.
Examples of seismic noise in Yellowstone caused by people
Examples of seismic noise in Yellowstone caused by peopleWebicorders of Yellowstone Seismic Network stations YMR (West Entrance road) and YNM (Norris Geyser Basin Museum) showing traffic signals (left) and visitors walking (right) during daytime hours. Both records span the entire 24-hour period of July 23, 2024, MDT.

Aerial view of Biscuit Basin, Yellowstone National Park, showing debris deposited by the July 23, 2024, hydrothermal explosion from Black Diamond Pool
Aerial view of Biscuit Basin, Yellowstone National Park, showing debris deposited by the July 23, 2024, hydrothermal explosion from Black Diamond PoolAerial view of Biscuit Basin, Yellowstone National Park, showing debris deposited by the July 23, 2024, hydrothermal explosion from Black Diamond Pool. Major features are labeled. The main debris field (within dashed yellow line) has a gray appearance. Photo taken by Joe Bueter, Yellowstone National Park, on July 23, 2024.
Aerial view of Biscuit Basin, Yellowstone National Park, showing debris deposited by the July 23, 2024, hydrothermal explosion from Black Diamond Pool
Aerial view of Biscuit Basin, Yellowstone National Park, showing debris deposited by the July 23, 2024, hydrothermal explosion from Black Diamond PoolAerial view of Biscuit Basin, Yellowstone National Park, showing debris deposited by the July 23, 2024, hydrothermal explosion from Black Diamond Pool
Aerial view of Biscuit Basin, Yellowstone National Park, showing debris deposited by the July 23, 2024, hydrothermal explosion from Black Diamond PoolAerial view of Biscuit Basin, Yellowstone National Park, showing debris deposited by the July 23, 2024, hydrothermal explosion from Black Diamond Pool. Major features are labeled. The main debris field (within dashed yellow line) has a gray appearance. Photo taken by Joe Bueter, Yellowstone National Park, on July 23, 2024.

High-resolution Planet satellite image of Biscuit Basin, Yellowstone National Park, from July 21, 2024
High-resolution Planet satellite image of Biscuit Basin, Yellowstone National Park, from July 21, 2024High-resolution Planet satellite image of Biscuit Basin, Yellowstone National Park, from July 21, 2024. This work utilized data made available through the NASA Commercial Smallsat Data Acquisition (CSDA) Program. Data are copyright, Planet Labs Inc. 2024, all rights reserved.
Map of major features in Biscuit Basin, Yellowstone National Park
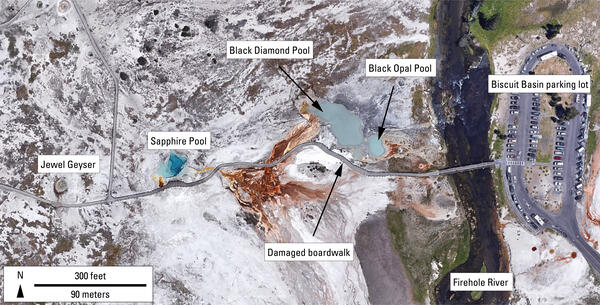
Map of major features in Biscuit Basin, Yellowstone National ParkMap of major thermal features in Biscuit Basin, Yellowstone National Park. Base map from Google Earth
Map of major features in Biscuit Basin, Yellowstone National Park
Map of major features in Biscuit Basin, Yellowstone National ParkMap of major thermal features in Biscuit Basin, Yellowstone National Park. Base map from Google Earth

Earthquakes located at Mount St. Helens from 2008-2024, a non-eruptive period.
Earthquakes located at Mount St. Helens from 2008-2024, a non-eruptive period.Earthquakes located at Mount St. Helens from 2008-2024, a non-eruptive period. This activity is consistent with normal, background levels. Top: Earthquake events located per week. The orange color at the far right denotes earthquakes from February to June 2024. Bottom: Earthquake depths below sea level (bsl) in kilometers.

Comparison of February-June 2024 seismicity to previous seismic swarms (1987-2004).
Comparison of February-June 2024 seismicity to previous seismic swarms (1987-2004).Comparison of February-June 2024 seismicity to previous seismic swarms (1987-2004). Upper left: Map of Mount St. Helens with a grayscale representing a digital elevation model. Earthquakes interpreted as recharge between 1987 and 2004 are plotted as a heatmap of earthquake density.

Graphic depicting 350 earthquakes that were located at Mount St. Helens between February 1 to June 17, 2024
Graphic depicting 350 earthquakes that were located at Mount St. Helens between February 1 to June 17, 2024From February 1 to June 17, 2024, approximately 350 earthquakes were located at Mount St. Helens by the Pacific Northwest Seismic Network. Over 95% of the earthquakes were less than a magnitude 1.0 and too small to be felt at the surface. The number of earthquakes located per week appears to have reached a peak in early June, at 38 events per week. USGS graphic.

Aerial photo of Mount St. Helens June 2024
Aerial photo of Mount St. Helens (center), with Mount Hood (in the distance, far left), Spirit Lake (on left with floating log mat), and St. Helens Lake with a little ice cover (lower left). USGS image taken by K. Spicer on June 6, 2024.
Aerial photo of Mount St. Helens (center), with Mount Hood (in the distance, far left), Spirit Lake (on left with floating log mat), and St. Helens Lake with a little ice cover (lower left). USGS image taken by K. Spicer on June 6, 2024.

Animation of annual Yellowstone seismicity 2017-2023
Animation of annual Yellowstone seismicity 2017-2023This animation shows a map of of Yellowstone seismicity by year from 2017 through 2023. Earthquakes are red circles, with the circle size indicating earthquake magnitude. Gray lines are roads, black dashed line shows the caldera boundary, Yellowstone National Park is outlined by black dot-dashed line, and gray dashed lines denote state boundaries.