
The Hawaiian Volcano Observatory technician team did maintenance on the Hualālai repeater station during the week of April 10, 2023. This photo shows the team walking towards the site, which is an important telemetry hub for Hawaiian Volcano Observatory volcano monitoring data. Mauna Kea and Mauna Loa are visible in the background. USGS image by M. Warren.
Images
Volcano Science Center images.
Filter Total Items: 564

April 12, 2023 — HVO Upgrades Hualālai Repeater
The Hawaiian Volcano Observatory technician team did maintenance on the Hualālai repeater station during the week of April 10, 2023. This photo shows the team walking towards the site, which is an important telemetry hub for Hawaiian Volcano Observatory volcano monitoring data. Mauna Kea and Mauna Loa are visible in the background. USGS image by M. Warren.

April 12, 2023 — HVO installs a new webcam at the Hualālai Repeater, looking at Mauna Loa
April 12, 2023 — HVO installs a new webcam at the Hualālai Repeater, looking at Mauna LoaThe lead electronics technician at the Hawaiian Volcano Observatory checks that the new HLcam is transmitting. The HLcam is located on the southeast side of Hualālai and provides views of the northwest flank of Mauna Loa.

April 12, 2023 — HVO Upgrades Hualālai Repeater
Hawaiian Volcano Observatory technicians upgraded the Hualālai repeater station to lithium batteries, despite the chilly temperatures on Hualālai. USGS image by M. Warren.
Hawaiian Volcano Observatory technicians upgraded the Hualālai repeater station to lithium batteries, despite the chilly temperatures on Hualālai. USGS image by M. Warren.

Geologic map of the Timber Hill basalt Sweetwater Hills, Montana
Geologic map of the Timber Hill basalt Sweetwater Hills, MontanaSimplified geologic map of the Timber Hill basalt and underlying geology in the Sweetwater Hills. The Sweetwater Road is shown by red. Note the basalt flow generally rests on poorly cemented sediments of the Sixmile Creek Formation shown in orange. Map by Jesse Mosolof (Montana Bureau of Mines and Geology).

Simplified map of the Wyoming Province
Simplified map of the Wyoming Province—a craton composed of Archean-age continental crust. Archean- and Proterozoic-age rocks outcrop in many places within the Wyoming Province and are shown as dark grey blobs. The yellow blob highlights the location of the Hellroaring and Crevice plutons, a small portion of which are exposed in northern Yellowstone National Park.
Simplified map of the Wyoming Province—a craton composed of Archean-age continental crust. Archean- and Proterozoic-age rocks outcrop in many places within the Wyoming Province and are shown as dark grey blobs. The yellow blob highlights the location of the Hellroaring and Crevice plutons, a small portion of which are exposed in northern Yellowstone National Park.

Map of Timber Hill basalt in the context of the Yellowstone hotspot track
Map of Timber Hill basalt in the context of the Yellowstone hotspot trackMap of the northwestern U.S., showing the approximate locations of the Yellowstone hotspot volcanic fields (orange) and Columbia River Basalts (gray). Boundary of Yellowstone National Park is shown in yellow. Inset shows physiographic map of southwest Montana and central Idaho.

Geologists work to collect sediment cores from ice-covered Henrys Lake, Idaho
Geologists work to collect sediment cores from ice-covered Henrys Lake, IdahoUSGS scientists work to recover sediment cores from Henrys Lake, Idaho. (Left): geologists traverse frozen Henrys Lake with coring supplies. USGS photo by Sylvia Nicovich, March 30, 2023. (Right) Geologists lower the corer into the lake through a hole augured through the ice. USGS photo by Chris DuRoss, March 31, 2023.

Frying Pan Lake, New Zealand
Frying Pan Lake (also called Waimangu Cauldron), in New Zealand, sits within Echo Crater, which formed during the 1886 eruption of Tarawera. A hydrothermal explosion from the crater in 1917 resulted in the formation of the hot spring "lake" by 1918.
Frying Pan Lake (also called Waimangu Cauldron), in New Zealand, sits within Echo Crater, which formed during the 1886 eruption of Tarawera. A hydrothermal explosion from the crater in 1917 resulted in the formation of the hot spring "lake" by 1918.
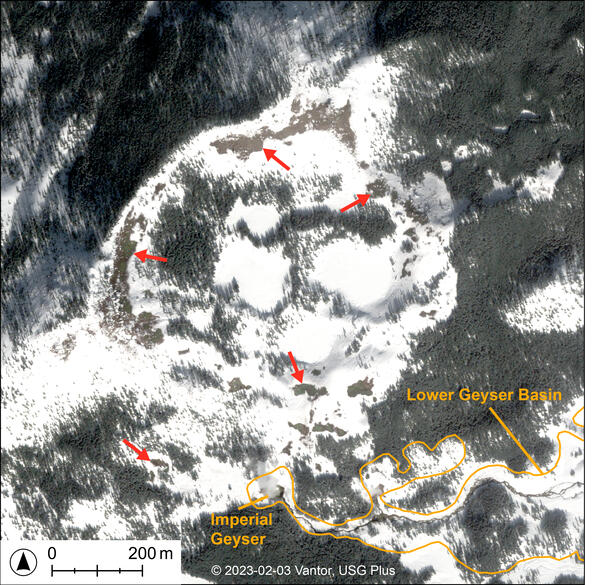
Subtle thermal ground revealed by wintertime satellite imagery of Twin Buttes, Yellowstone National Park
Subtle thermal ground revealed by wintertime satellite imagery of Twin Buttes, Yellowstone National ParkWorldView-2 natural-color satellite image from February 3, 2023, showing snow-free zones around Twin Buttes, just beyond the southwest portion of Lower Geyser Basin. At the time and date this image was acquired, there was extensive

Map of the distribution of pH for thermal pools within Norris Geyser Basin, Yellowstone National Park
Map of the distribution of pH for thermal pools within Norris Geyser Basin, Yellowstone National ParkMap of the distribution of pH for thermal pools within Norris Geyser Basin, Yellowstone National Park. Cool colors are acidic, and warm colors are neutral to slightly basic. These data were collected and organized using Geographic Information System (GIS) tools. Map by Jefferson Hungerford and Kiernan Folz-Donahue, Yellowstone National Park.

Volcanic deposits associated with the Absaroka volcanic province along the eastern and northern boundaries of Yellowstone National Park
Volcanic deposits associated with the Absaroka volcanic province along the eastern and northern boundaries of Yellowstone National ParkVolcanic deposits associated with the Absaroka volcanic province along the eastern and northern boundaries of Yellowstone National Park. The left panel shows the spread of the Absaroka Volcanic Supergroup (AVS) throughout Wyoming and Montana.

Isotopic composition of units within the Absaroka volcanic province
Isotopic composition of units within the Absaroka volcanic provinceIsotopic composition of the primary volcanic groups of the Absaroka volcanic province (the Washburn, Sunlight, and Thorofare groups) and two volcaniclastic units, the Sepulcher formation and the Daly formation.

Landsat 8 nighttime thermal infrared image of Yellowstone National Park from January 31, 2023
Landsat 8 nighttime thermal infrared image of Yellowstone National Park from January 31, 2023Landsat 8 nighttime thermal infrared image of Yellowstone National Park from January 31, 2023. Satellite-based thermal infrared data show areas on the surface that are warmer versus cooler, and they can be used to estimate surface temperature and the geothermal radiative heat output from the Yellowstone magmatic and hydrothermal system.

Halema‘uma‘u lava fountain on lava lake surface
This image, taken early on January 6th, shows a lava fountain on the eastern portion of Halema‘uma‘u. Numerous areas of upwelling, like the one pictured here, are actively feeding the lava lake and re-surfacing material that was emplaced from activity in 2022. This fountain measured 16-33 feet in height (5-10 meters).
This image, taken early on January 6th, shows a lava fountain on the eastern portion of Halema‘uma‘u. Numerous areas of upwelling, like the one pictured here, are actively feeding the lava lake and re-surfacing material that was emplaced from activity in 2022. This fountain measured 16-33 feet in height (5-10 meters).

HVO scientist views new eruption in Halema‘uma‘u crater
HVO scientist views new eruption in Halema‘uma‘u craterA USGS Hawaiian Volcano Observatory geologist documents the new eruption within Halema‘uma‘u crater, at Kīlauea summit within Hawai‘i Volcanoes National Park. The eruption began just after 4:30 p.m. on January 5, 2023, and remains confined to Halema‘uma‘u crater. USGS image by D. Downs.

Upgrade to Kīlauea summit webcam
The KWcam webcam, on the west rim of Kīlauea caldera, was upgraded on January 4, 2023, to a more advanced model, which provides a slightly wider view and higher image quality. This should provide an improved view of any future activity in Halema‘uma‘u. In this photo, an HVO scientist begins the process of the webcam swap. USGS photo by M. Patrick.
The KWcam webcam, on the west rim of Kīlauea caldera, was upgraded on January 4, 2023, to a more advanced model, which provides a slightly wider view and higher image quality. This should provide an improved view of any future activity in Halema‘uma‘u. In this photo, an HVO scientist begins the process of the webcam swap. USGS photo by M. Patrick.

Geology of the unconformity on Mount Everts in Yellowstone National Park
Geology of the unconformity on Mount Everts in Yellowstone National ParkGeology of the unconformity on Mount Everts in Yellowstone National Park. Sketch at the top was made by geologist William Henry Holmes in 1878 and correctly identifies Cretaceous sediments overlain by much younger rhyolite rocks, including fine ash deposits (“tufa”). The photo at the bottom shows the same outcrop as viewed from Mammoth Hot Springs (USGS

Plot of Yellowstone Lake level in June 13, 2021, showing a repeating seiche wave
Plot of Yellowstone Lake level in June 13, 2021, showing a repeating seiche waveAn example of the repeating seiche—a long-period oscillatory wave that can be present on a lake—measured over the course of a day by the lake-level sensor at the Grant Village boat dock on the West Thumb of Yellowstone Lake. The plot shows a cyclic variation of about 2 centimeters that occurs numerous times during June 13, 2021.

SP Crater in the San Francisco volcanic field of northern Arizona
SP Crater in the San Francisco volcanic field of northern ArizonaSP Crater (right foreground), like many volcanoes in Arizona’s San Francisco volcanic field, erupted mafic lava that lacks sanidine crystals.
SP Crater in the San Francisco volcanic field of northern Arizona
SP Crater in the San Francisco volcanic field of northern ArizonaSP Crater (right foreground), like many volcanoes in Arizona’s San Francisco volcanic field, erupted mafic lava that lacks sanidine crystals.
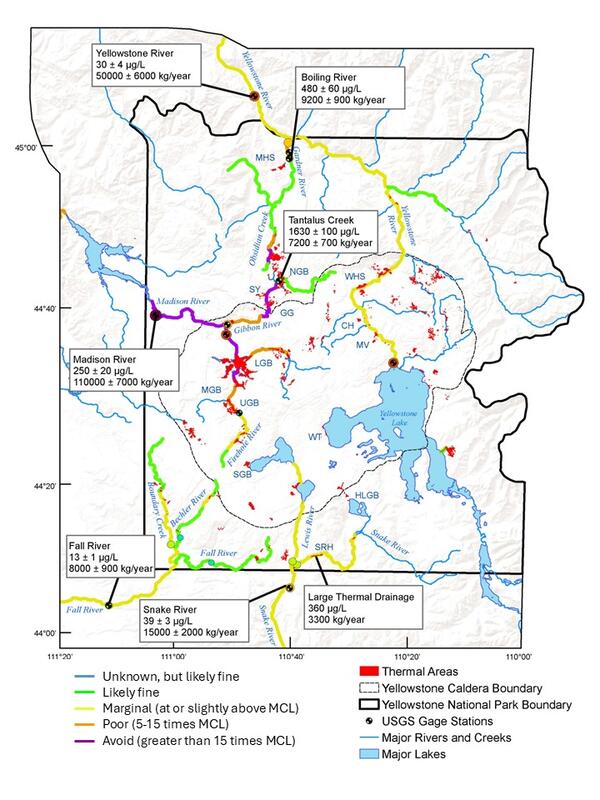
Map of arsenic concentrations in Yellowstone National Park rivers
Map of arsenic concentrations in Yellowstone National Park riversMap of Yellowstone National Park lakes, rivers, and streams, with colors indicating the amount of arsenic in the water. The Maximum Contaminant Level (MCL) defined by the Environmental Protection Agency for arsenic in drinking water is 10 micrograms per liter (µg/L). In the vicinity of major geyser basins, especially on the Firehole and Madison Rivers, a

Images of an unnamed thermal feature in the Three River Junction thermal area in southwest Yellowstone National Park
Images of an unnamed thermal feature in the Three River Junction thermal area in southwest Yellowstone National ParkImages of an unnamed thermal feature in the Three River Junction thermal area in southwest Yellowstone National Park. A, WorldView-3 satellite image from September 2014. B, National Park Service (NPS) aerial photograph from 2017. Images A and B were acquired before the feature went largely dry in late 2019 or 2020. C, WorldView-3 satellite image from June 2020.