
Steamboat Geyser erupting on 23 May 2022. Dead and downed trees can be seen in the foreground. Photo by Mara Reed, UC Berkeley, May 23, 2022.
Images
Volcano Science Center images.
Filter Total Items: 564

Steamboat Geyser erupting on 23 May 2022
Steamboat Geyser erupting on 23 May 2022. Dead and downed trees can be seen in the foreground. Photo by Mara Reed, UC Berkeley, May 23, 2022.
Calcite Springs thermal area in Yellowstone National Park
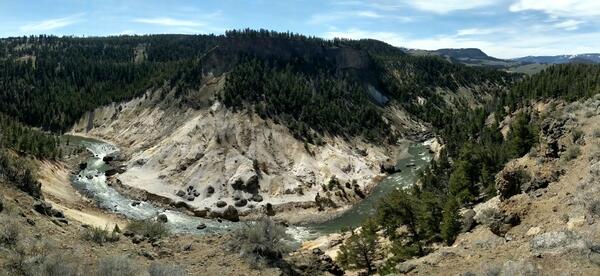
Calcite Springs thermal area in Yellowstone National ParkCalcite Springs thermal area in Yellowstone National Park. Calcite Springs is the white altered ground. Dark deposits (not apparent in this photo) are sometimes discharged from fumaroles and are made of either oxidized sulfur or hydrocarbons. USGS photo by Mike Poland, May 15, 2022.
Calcite Springs thermal area in Yellowstone National Park
Calcite Springs thermal area in Yellowstone National ParkCalcite Springs thermal area in Yellowstone National Park. Calcite Springs is the white altered ground. Dark deposits (not apparent in this photo) are sometimes discharged from fumaroles and are made of either oxidized sulfur or hydrocarbons. USGS photo by Mike Poland, May 15, 2022.

Scientists install a semipermanent GPS station in Yellowstone National Park
Scientists install a semipermanent GPS station in Yellowstone National ParkScientists install a semipermanent GPS station in Yellowstone National Park. These stations, which are not radio-telemetered, are typically installed in May and recovered in October, when the data are downloaded and processed. These stations help to supplement the continuous GPS network in the Yellowstone area.

Yellowstone Volcano Observatory biennial meeting in May 2022
Yellowstone Volcano Observatory biennial meeting in May 2022Scientists and collaborators of the Yellowstone Volcano Observatory meet in Mammoth Hot Springs in May 2022 to discuss the protocols for responding to a geological event in Yellowstone National Park.

Mammoth Hot Springs Hotel, Yellowstone National Park
Mammoth Hot Springs Hotel, Yellowstone National ParkMammoth Hot Springs Hotel in Yellowstone National Park, where Yellowstone Volcano Observatory scientists met in May 2022 to discuss recent scientific results and to revise the Observatory's plan for responding to geological unrest.

GPS station P711 near Madison Campground, Yellowstone National Park
GPS station P711 near Madison Campground, Yellowstone National ParkContinuous GPS station P711 near Madison Campground. Photo by Scott K. Johnson (UNAVCO) on May 11, 2022.
GPS station P711 near Madison Campground, Yellowstone National Park
GPS station P711 near Madison Campground, Yellowstone National ParkContinuous GPS station P711 near Madison Campground. Photo by Scott K. Johnson (UNAVCO) on May 11, 2022.

Yellowstone Volcano Observatory scientist-in-charge Mike Poland replaces batteries in a temperature logger in Norris Geyser Basin.
Yellowstone Volcano Observatory scientist-in-charge Mike Poland replaces batteries in a temperature logger in Norris Geyser Basin.Yellowstone Volcano Observatory scientist-in-charge Mike Poland replaces batteries in a temperature logger in Norris Geyser Basin.

Cathodoluminescence images of zircon mineral grains from an Archean-age rock found in the Yellowstone region
Cathodoluminescence images of zircon mineral grains from an Archean-age rock found in the Yellowstone regionCathodoluminescence images generated by the interaction of electromagnetic radiation ranging in energy from ultraviolet to near infrared with sectioned and polished zircon mineral grains from an Archean-age rock found in the Yellowstone region.

Annie Carlson, Research Permitting Coordinator for Yellowstone National Park during 2017–2023
Annie Carlson, Research Permitting Coordinator for Yellowstone National Park during 2017–2023Annie Carlson, Research Permitting Coordinator for Yellowstone National Park during 2017–2023. National Park Service photo by Jake Frank, May 2022.

Cover of Yellowstone Volcano Observatory 2021 Annual Report
Cover of Yellowstone Volcano Observatory 2021 Annual ReportFront cover of the Yellowstone Volcano Observatory 2021 annual report, which includes a summary of earthquake, deformation, and geyser activity, as well as research investigations and other information. The report is freely available online at https://pubs.er.usgs.gov/publication/cir1494.

Color-shaded bathymetric map of Yellowstone Lake
Color-shaded bathymetric map of Yellowstone Lake showing locations of sediment cores and major tectonic features (faults, fractures, lineaments, caldera margins) and hydrothermal areas (vents, domes, hydrothermal explosion craters).
Color-shaded bathymetric map of Yellowstone Lake showing locations of sediment cores and major tectonic features (faults, fractures, lineaments, caldera margins) and hydrothermal areas (vents, domes, hydrothermal explosion craters).

Resistivity and magnetic susceptibility cross sections from Yellowstone thermal areas
Resistivity and magnetic susceptibility cross sections from Yellowstone thermal areasCross sections from one-dimensional electrical resistivity (top of each section) and three-dimensional magnetic susceptibility inverted models (bottom of each section) along profiles that span (a) Norris Geyser Basin, and (b) Upper Geyser Basin. Geologic and geothermal features are from the Yellowstone geologic map. VE=vertical exaggeration.

Map of Yellowstone National Park showing geologic structures and thermal areas
Map of Yellowstone National Park showing geologic structures and thermal areasMap of Yellowstone National Park showing geologic structures, including the caldera, inner ring fault, and resurgent domes, and and thermal areas (colored red).

Map of Two Ocean Pass and the Parting of the Waters
Map of Two Ocean Pass and the Parting of the WatersMap of Two Ocean Pass and the Parting of the Waters. Pacific Creek flows southwest toward the Snake River, and Atlantic Creek flows northeast toward the Yellowstone River. The green line is the Continental Divide.

Examples of some of the instrumentation commonly found in a geology experimental research lab
Examples of some of the instrumentation commonly found in a geology experimental research labExamples of some of the instrumentation commonly found in a geology experimental research lab.
Examples of some of the instrumentation commonly found in a geology experimental research lab
Examples of some of the instrumentation commonly found in a geology experimental research labExamples of some of the instrumentation commonly found in a geology experimental research lab.

Map of the Continental Divide in North America
Map of North American showing the Continental Divide -- an invisible line that separates the major watersheds flowing to different oceans.
Map of North American showing the Continental Divide -- an invisible line that separates the major watersheds flowing to different oceans.

Yellowstone rhyolite generation
Schematic cross section of the magmatic system underneath Yellowstone Caldera and illustrating the processes of rhyolite formation.
Schematic cross section of the magmatic system underneath Yellowstone Caldera and illustrating the processes of rhyolite formation.

Plot comparing caldera deformation
Vertical deformation measured at three caldera systems: Yellowstone, Wyoming (red), Long Valley, California (green), and Campi Flegrei, Italy (blue). Triangles show data collected by leveling, and circles by GPS. All three calderas have gone up and down over time, but the scale of change at Campi Flegrei dwarfs that at Long Valley and Yellowstone.
Vertical deformation measured at three caldera systems: Yellowstone, Wyoming (red), Long Valley, California (green), and Campi Flegrei, Italy (blue). Triangles show data collected by leveling, and circles by GPS. All three calderas have gone up and down over time, but the scale of change at Campi Flegrei dwarfs that at Long Valley and Yellowstone.

Photo and lidar image of Silver Gate landslide, Yellowstone National Park
Photo and lidar image of Silver Gate landslide, Yellowstone National ParkTop image is a view of the Silver Gate landslide complex, near Mammoth Hot Springs, from Bunsen Peak. Bottom shows roughly the same view using lidar data, colored to show elevation highs and lows and shaded by slope. Landslide scarps, roads, trails, and Glen Creek (lower left), all obscured by trees in the photograph, are much more visible in the lidar.

Landscape change in Lamar Valley, Yellowstone National Park, detected by lidar
Landscape change in Lamar Valley, Yellowstone National Park, detected by lidar3D renderings of elevation change between August 2007 and October 2020 along the Lamar River in the northeast part of Yellowstone National Park. Red regions represent >1 m (3 ft) of elevation loss, yellow indicates no change, and blue represents >1 m (3 ft) of elevation gain.

Spectrogram and waveform of a possible long-period earthquake in Yellowstone
Spectrogram and waveform of a possible long-period earthquake in YellowstoneSpectrogram of a possible long-period (LP) earthquake in Yellowstone that occurred on August 26, 2021, near Norris Geyser Basin. The top panel shows a 30-second seismogram recorded at seismic station YHH. The bottom panel shows the spectrogram with energy concentrated in the 1–3 Hz range and lasting for ~15 seconds.