
Map interface of Cores, grabs, dredges, slides, and other samples, primarily of marine, estuarine, and lacustrine sediments, curated at the USGS Woods Hole Coastal and Marine Science Center.
Images
Woods Hole Coastal and Marine Science Center images
Filter Total Items: 1312

Samples Repository Collections map interface
Map interface of Cores, grabs, dredges, slides, and other samples, primarily of marine, estuarine, and lacustrine sediments, curated at the USGS Woods Hole Coastal and Marine Science Center.

Map showing the location of the Delmarva Peninsula
Map showing the location of the Delmarva PeninsulaMap showing the location of the Delmarva Peninsula with a hillslope shaded relief map of the study area.
Map showing the location of the Delmarva Peninsula
Map showing the location of the Delmarva PeninsulaMap showing the location of the Delmarva Peninsula with a hillslope shaded relief map of the study area.
Drone lands on the landing target
Emily Sturdivant, with the help of her co-pilot, hits the landing target.
Emily Sturdivant, with the help of her co-pilot, hits the landing target.

Diver collecting samples
David Brankovits collecting water samples in Molnar Janos Cave in Budapest, Hungary.
David Brankovits collecting water samples in Molnar Janos Cave in Budapest, Hungary.

Elizabeth Pendleton describes USGS work to map the Mass. seafloor
Elizabeth Pendleton describes USGS work to map the Mass. seafloorElizabeth Pendleton describes USGS work to map the Massachusetts seafloor to State Senator Viriato “Vinny” deMacedo.
Elizabeth Pendleton describes USGS work to map the Mass. seafloor
Elizabeth Pendleton describes USGS work to map the Mass. seafloorElizabeth Pendleton describes USGS work to map the Massachusetts seafloor to State Senator Viriato “Vinny” deMacedo.

Orthomosaic and DEM images of Matanzas, Florida
Orthomosaic images of Matanzas, Florida, from (a) before and (b) after Hurricane Matthew, and (c) a digital elevation model (DEM) showing the associated topographic change. Note, these results were produced by applying Structure-from-Motion (SfM) to NOAA oblique photographs, but similar results can be obtained using UAS aerial imagery.
Orthomosaic images of Matanzas, Florida, from (a) before and (b) after Hurricane Matthew, and (c) a digital elevation model (DEM) showing the associated topographic change. Note, these results were produced by applying Structure-from-Motion (SfM) to NOAA oblique photographs, but similar results can be obtained using UAS aerial imagery.
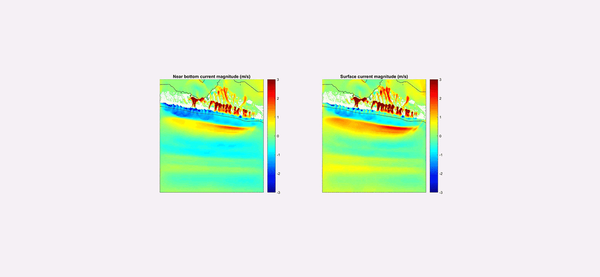
A short animation contrasts the sand movement during Hurricane Sandy
A short animation contrasts the sand movement during Hurricane SandyUSGS scientists built a model that reproduces the waves, currents (shown in meters per second [m/s]), and sand movement at Fire Island during Hurricane Sandy’s passage (Warner and others, 2017).

Perspective views of multibeam bathymetry data acquired by the USGS
Perspective views of multibeam bathymetry data acquired by the USGSPerspective views of multibeam bathymetry data acquired by the USGS aboard the R/V Medeia. Shallower depths in red. Arrows point to the distinct line in the seafloor associated with the Queen Charlotte-Fairweather fault.

Woods Hole Science Center hosts Woods Hole Science School students
Woods Hole Science Center hosts Woods Hole Science School studentsMichael Casso, Woods Hole Coastal and Marine Science Center physical scientist, seeks volunteers from Children’s School of Science students to have their breath measured for carbon dioxide and methane, greenhouse gases USGS scientists measure in the oceans
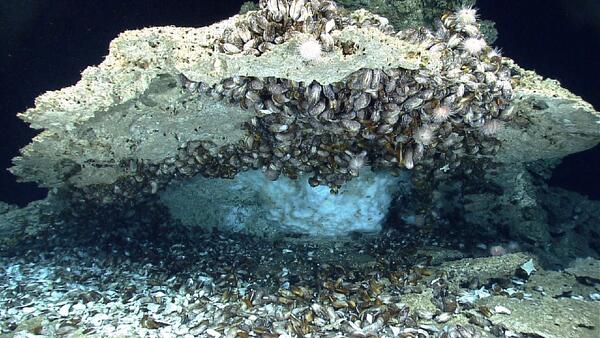
Ice-like gas hydrates under capping rock encrusted with mussels
Ice-like gas hydrates under capping rock encrusted with musselsIce-like gas hydrates under capping rock encrusted with mussels on the sea floor of the northern Gulf of America.
Ice-like gas hydrates under capping rock encrusted with mussels
Ice-like gas hydrates under capping rock encrusted with musselsIce-like gas hydrates under capping rock encrusted with mussels on the sea floor of the northern Gulf of America.

Pilots and Politics
USGS pilot Sandy Brosnahan and Senate Pro Tempore Marc Pacheco discuss the use of Umanned Aerial Systems (UASs, also known as drones) to collect data in coastal environments.
USGS pilot Sandy Brosnahan and Senate Pro Tempore Marc Pacheco discuss the use of Umanned Aerial Systems (UASs, also known as drones) to collect data in coastal environments.

Methane Plumes
(Top) Methane plumes at the Norfolk Canyon seeps (~1600 meters or 5250 feet) were detected using the EK60 sonar. The water column plumes are shown above the sub-seafloor structure as imaged by high-resolution multichannel seismic data acquired by the USGS and processed by J. Kluesner.
(Top) Methane plumes at the Norfolk Canyon seeps (~1600 meters or 5250 feet) were detected using the EK60 sonar. The water column plumes are shown above the sub-seafloor structure as imaged by high-resolution multichannel seismic data acquired by the USGS and processed by J. Kluesner.

IMMeRSS Cruise expedition area
Map of the general expedition area on the northern U.S. Atlantic Margin between Baltimore Canyon and Cape Hatteras
Map of the general expedition area on the northern U.S. Atlantic Margin between Baltimore Canyon and Cape Hatteras

Map of distribution of fine- and coarse-grained sand, Stellwagen Bank
Map of distribution of fine- and coarse-grained sand, Stellwagen BankMap of distribution of fine- and coarse-grained sand, Stellwagen Bank. Blue and purple = boulder ridges. Redlines = leading edges of sand sheets
Map of distribution of fine- and coarse-grained sand, Stellwagen Bank
Map of distribution of fine- and coarse-grained sand, Stellwagen BankMap of distribution of fine- and coarse-grained sand, Stellwagen Bank. Blue and purple = boulder ridges. Redlines = leading edges of sand sheets

Tiny bubbles (of methane)
Methane bubbles emerging from the seafloor at a seep site colonized by chemosynthetic mussels at ~1000 m water depth on the Virginia margin. Photograph taken by the Global Explorer operated by Oceaneering Inc.
Methane bubbles emerging from the seafloor at a seep site colonized by chemosynthetic mussels at ~1000 m water depth on the Virginia margin. Photograph taken by the Global Explorer operated by Oceaneering Inc.

Multicorer deployment to sample the seafloor
USGS ocean engineers Peter Dal Ferro and Gerry Hatcher, from the Pacific Coastal and Marine Science Center in Santa Cruz, California, deploying a multicorer to sample the seafloor near an Atlantic margin methane seep site.
USGS ocean engineers Peter Dal Ferro and Gerry Hatcher, from the Pacific Coastal and Marine Science Center in Santa Cruz, California, deploying a multicorer to sample the seafloor near an Atlantic margin methane seep site.
A USGS drone pilot demonstrates flying an Unmanned Aircraft System
A USGS drone pilot demonstrates flying an Unmanned Aircraft SystemIt's a bird? It's a plane? It's a drone! USGS drone pilot Emily Sturdivant (seated) demonstrates flying an Unmanned Aircraft System (UAS), much to the delight of the onlookers.
Fieldtrip participants at the former San Clemente Dam site
Fieldtrip participants at the former San Clemente Dam siteFieldtrip participants at the former San Clemente Dam site.
Fieldtrip participants at the former San Clemente Dam site
Fieldtrip participants at the former San Clemente Dam siteFieldtrip participants at the former San Clemente Dam site.

Map shows hill-shaded bathymetric, backscatter, and photographic data
Map shows hill-shaded bathymetric, backscatter, and photographic dataHill-shaded bathymetric, backscatter, and photographic data collected by NOAA and the USGS. Backscatter data give indications of seafloor character. In general, low-backscatter intensity (blue) corresponds to finer-grained material, whereas high-backscatter intensity (orange) corresponds to coarser substrate.

The USGS conducted surveys on the inner continental shelf of the Delma
The USGS conducted surveys on the inner continental shelf of the DelmaThe USGS conducted surveys on the inner continental shelf of the Delmarva Peninsula (shown in green) to complement related datasets previously collected in the area by partners NOAA and BOEM. The inset map shows location of the study area.

The 3DR Solo with GoPro Hero4 camera and gimbal
The 3DR Solo with GoPro Hero4 camera and gimbal. Coming to a survey area near you soon.
The 3DR Solo with GoPro Hero4 camera and gimbal. Coming to a survey area near you soon.