
Sample preparation and processing area in the K.O. Emery Geotechnical Wing at the Woods Hole Coastal and Marine Science Center, Woods Hole, MA
Images
Woods Hole Coastal and Marine Science Center images
Filter Total Items: 1334

Sample preparation and processing area
Sample preparation and processing area in the K.O. Emery Geotechnical Wing at the Woods Hole Coastal and Marine Science Center, Woods Hole, MA
Marinna Martini prepares to deploy a NIMBBLE from the R/V Connecticut
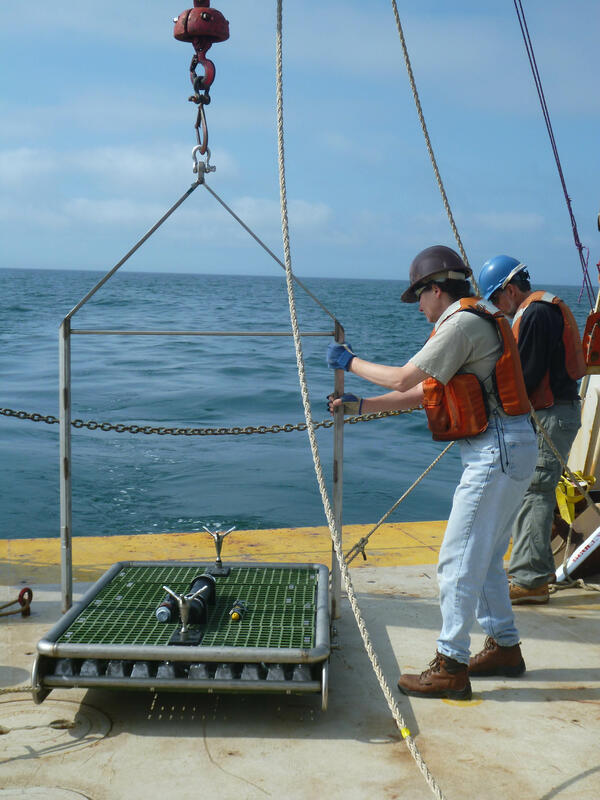
Marinna Martini prepares to deploy a NIMBBLE from the R/V ConnecticutMarinna Martini prepares to deploy a NIMBBLE from the R/V Connecticut south of Martha's Vineyard
Marinna Martini prepares to deploy a NIMBBLE from the R/V Connecticut
Marinna Martini prepares to deploy a NIMBBLE from the R/V ConnecticutMarinna Martini prepares to deploy a NIMBBLE from the R/V Connecticut south of Martha's Vineyard

A Sontek IQ ADCP measures depth and velocity of a salt marsh creek
A Sontek IQ ADCP measures depth and velocity of a salt marsh creekA Sontek IQ ADCP measures depth and velocity of a salt marsh creek (Cape Cod, MA)
A Sontek IQ ADCP measures depth and velocity of a salt marsh creek
A Sontek IQ ADCP measures depth and velocity of a salt marsh creekA Sontek IQ ADCP measures depth and velocity of a salt marsh creek (Cape Cod, MA)

Collecting samples from a salt marsh
Jen Suttles collects water samples from a salt marsh tidal creek (East Falmouth, MA) for laboratory analysis of total organic carbon. These samples will be compared to data recorded by instrumentation deployed in an adjacent tidal creek as part of research efforts to quantify carbon dynamics in coastal ecosystems
Jen Suttles collects water samples from a salt marsh tidal creek (East Falmouth, MA) for laboratory analysis of total organic carbon. These samples will be compared to data recorded by instrumentation deployed in an adjacent tidal creek as part of research efforts to quantify carbon dynamics in coastal ecosystems

Salt Marsh Observatory at Sage Lot Pond in the Waquoit Bay, MA
Salt Marsh Observatory at Sage Lot Pond in the Waquoit Bay, MAThe Salt Marsh Observatory at Sage Lot Pond in the Waquoit Bay National Estuarine Research Reserve serves as an important platform for research in coastal salt marshes. Infrastrucutre in this marsh allows researchers to access sites while maintaining habitat and platform health.

Sara Zeigler (USGS) uses the smartphone data collection app ‘iPlover’
Sara Zeigler (USGS) uses the smartphone data collection app ‘iPlover’Sara Zeigler (USGS) uses the smartphone data collection app ‘iPlover’ to classify the landscape characteristics in an area immediately surrounding a piping plover nest (here, protected with a black mesh predator exclosure).


Sand fencing can affect natural beach processes
Human modifications to beaches, such as sand fencing, sea walls and rock jetties, can alter natural beach processes like overwash. This can affect how much habitat for species like piping plovers is created by storms.
Human modifications to beaches, such as sand fencing, sea walls and rock jetties, can alter natural beach processes like overwash. This can affect how much habitat for species like piping plovers is created by storms.

Area Closed
USGS scientists are working to model shorebird habitat availability both today and in the future, given processes like sea-level rise, in an effort to support the efficient management of beaches for both people and nesting shorebirds. This photo shows an area on the Rockaway Peninsula where high quality shorebird habitat has been closed off to beach recreation.
USGS scientists are working to model shorebird habitat availability both today and in the future, given processes like sea-level rise, in an effort to support the efficient management of beaches for both people and nesting shorebirds. This photo shows an area on the Rockaway Peninsula where high quality shorebird habitat has been closed off to beach recreation.

Gateway National Recreation Area shown here on the Rockaway Peninsula
Gateway National Recreation Area shown here on the Rockaway PeninsulaThe beach-dependent shorebirds project at the Woods Hole Coastal and Marine Science Center models current and future habitat availability for nesting shorebirds in an effort to map current and likely future habitat availability on a range of sites along the U.S. Atlantic coast.

Piping plover parent and chicks
A piping plover parent and chicks.

Buoy recovery off Fire Island, NY
A buoy instrumented to collect meteorological observations is recovered off Fire Island, NY in 2014. The data collected is part of a study of the coastal processes that mobilize and transport sediment in the region
A buoy instrumented to collect meteorological observations is recovered off Fire Island, NY in 2014. The data collected is part of a study of the coastal processes that mobilize and transport sediment in the region

Dawn operations off Fire Island, NY
A remotely operated vessel starts a survey at dawn off Fire Island, NY in 2014. The data collected is part of a study of the coastal processes that mobilize and transport sediment in the region
A remotely operated vessel starts a survey at dawn off Fire Island, NY in 2014. The data collected is part of a study of the coastal processes that mobilize and transport sediment in the region

USGS tilt current meter (white cylinder) in overwash channel
USGS tilt current meter (white cylinder) in overwash channelUSGS tilt current meter (white cylinder) in overwash channel in the Sandwich Town Beach flooded during a Nor'Easter in March 2014
USGS tilt current meter (white cylinder) in overwash channel
USGS tilt current meter (white cylinder) in overwash channelUSGS tilt current meter (white cylinder) in overwash channel in the Sandwich Town Beach flooded during a Nor'Easter in March 2014

Oceanographic equipment covering the R/V Connecticut's deck
Oceanographic equipment covering the R/V Connecticut's deckEvery inch of the deck of the R/V Connecticut is covered by instrumented platforms awaiting deployment on the seafloor south of Fire Island NY in winter 2014.
Oceanographic equipment covering the R/V Connecticut's deck
Oceanographic equipment covering the R/V Connecticut's deckEvery inch of the deck of the R/V Connecticut is covered by instrumented platforms awaiting deployment on the seafloor south of Fire Island NY in winter 2014.

Oceanographic equipment covering the deck of the R/V Connecticut
Oceanographic equipment covering the deck of the R/V Connecticut
Every inch of the deck of the R/V Connecticut is covered by instrumented platforms awaiting deployment on the seafloor south of Fire Island NY in winter 2014.
Oceanographic equipment covering the deck of the R/V Connecticut
Oceanographic equipment covering the deck of the R/V Connecticut
Every inch of the deck of the R/V Connecticut is covered by instrumented platforms awaiting deployment on the seafloor south of Fire Island NY in winter 2014.

Snowy Owl
Snowy owl visitor to CCGS Louis S. St-Laurent in the Arctic Ocean
Snowy owl visitor to CCGS Louis S. St-Laurent in the Arctic Ocean

sonar on a bottom platform
A sonar on a bottom platform while steaming to the deployment site in the Columbia River in 2013. The 3 platforms acquired data on currents and sediment transport at the river mouth over several months.
A sonar on a bottom platform while steaming to the deployment site in the Columbia River in 2013. The 3 platforms acquired data on currents and sediment transport at the river mouth over several months.

Shaded relief image of Vineyard Sound, MA Shoals
Shaded relief image of Vineyard Sound, MA Shoals
Shaded relief image of Vineyard Sound, MA Shoals

USGS technicians prepare a sediment trap
USGS technicians prepare a sediment trap to sample the sea floor off Cape Hatteras.
USGS technicians prepare a sediment trap to sample the sea floor off Cape Hatteras.

Sampling seep gas through the ice in Lake Qalluuraq, Barrow Alaska
Sampling seep gas through the ice in Lake Qalluuraq, Barrow AlaskaUSGS research chemist John Pohlman samples seep gas through ice in Lake Qalluuraq, located in continuous permafrost approximately 97 kilometers (60 miles) south of Barrow, Alaska.