
Shows the location of mapped area (highlighted in yellow) in the Stellwagen Bank region off Boston, Massachusetts.
Images
Woods Hole Coastal and Marine Science Center images
Filter Total Items: 1334

Mapped area of Stellwagen Bank region
Shows the location of mapped area (highlighted in yellow) in the Stellwagen Bank region off Boston, Massachusetts.

Benthic Flux Chamber
The oxygen-regulated benthic flux chamber measures fluxes of water and chemical species across the sediment water interface. It is shown here deployed in the subtidal discharge zone in Indian River Bay, DE, USA
The oxygen-regulated benthic flux chamber measures fluxes of water and chemical species across the sediment water interface. It is shown here deployed in the subtidal discharge zone in Indian River Bay, DE, USA

Color hillside image of terrain model
Color hillshade image of terrain model of Barnegat Bay, New Jersey
Color hillshade image of terrain model of Barnegat Bay, New Jersey

Science outreach at Waquoit Bay National Estuarine Research Reserve.
Science outreach at Waquoit Bay National Estuarine Research Reserve.Science outreach at Waquoit Bay National Estuarine Research Reserve.
Science outreach at Waquoit Bay National Estuarine Research Reserve.
Science outreach at Waquoit Bay National Estuarine Research Reserve.Science outreach at Waquoit Bay National Estuarine Research Reserve.

U.S. Geological Survey scientist walks on a coastal bluff in Alaska.
U.S. Geological Survey scientist walks on a coastal bluff in Alaska.U.S. Geological Survey scientist walks on a coastal bluff in Alaska.
U.S. Geological Survey scientist walks on a coastal bluff in Alaska.
U.S. Geological Survey scientist walks on a coastal bluff in Alaska.U.S. Geological Survey scientist walks on a coastal bluff in Alaska.

Flooded airport runway in Barter Island, Alaska
This flooded airport runway used to be the main lifeline for inhabitants of Barter Island, Alaska, before it was relocated in response to consistent flooding.
This flooded airport runway used to be the main lifeline for inhabitants of Barter Island, Alaska, before it was relocated in response to consistent flooding.

Swath Bathymetric Grid
This bathymetric grid represents approximately 3900 kilometers of bathymetric data collected in 2014. These data were collected using a dual-head R2Sonic 2024 multibeam echosounder (MBES) by Alpine Ocean Seismic Survey, Inc., during USGS field activity 2014-072-FA.
This bathymetric grid represents approximately 3900 kilometers of bathymetric data collected in 2014. These data were collected using a dual-head R2Sonic 2024 multibeam echosounder (MBES) by Alpine Ocean Seismic Survey, Inc., during USGS field activity 2014-072-FA.

Divers prepare oceanographic equipment
Divers prepare patterns of known targets for verification of sonar resolution.
Divers prepare patterns of known targets for verification of sonar resolution.

Herring River Estuary, Cape Cod, MA
Tidally restricted wetland in the Herring River Estuary, Cape Cod, MA
Tidally restricted wetland in the Herring River Estuary, Cape Cod, MA

USGS scientists walk through a tern colony
USGS scientists walk through a tern colony on the Monomoy National Wildlife Refuge (MA). Here, these scientists are using ecogeomorphological models to predict how this refuge will be impacted by sea-level rise and how that will ultimately effect shorebirds.
USGS scientists walk through a tern colony on the Monomoy National Wildlife Refuge (MA). Here, these scientists are using ecogeomorphological models to predict how this refuge will be impacted by sea-level rise and how that will ultimately effect shorebirds.

Piping plover chicks concealed on a sandy beach
Piping plover chicks are well concealed in shallow nests on sandy beaches.
Piping plover chicks are well concealed in shallow nests on sandy beaches.

Soil core from coastal wetland
Scientists collect soil cores in coastal wetland by removing a section of peat, the organic-rich material that makes up salt marshes. After the soil is removed, water quickly fills in the void. This water-logged environment underground is devoid of oxygen and is an important reason that salt marsh peat preserves a record of historical changes.
Scientists collect soil cores in coastal wetland by removing a section of peat, the organic-rich material that makes up salt marshes. After the soil is removed, water quickly fills in the void. This water-logged environment underground is devoid of oxygen and is an important reason that salt marsh peat preserves a record of historical changes.
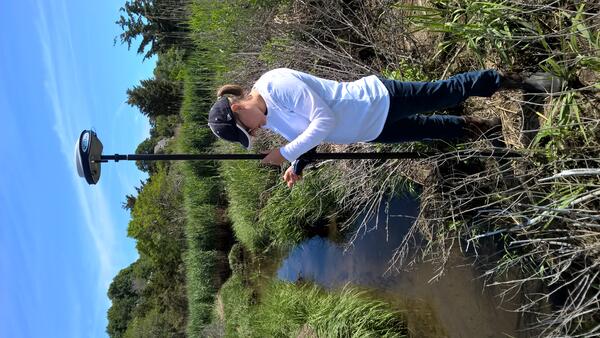
Meagan Eagle, USGS Research Scientist, collecting elevation points in Quivett Creek, Brewster, MA
Meagan Eagle, USGS Research Scientist, collecting elevation points in Quivett Creek, Brewster, MAMeagan Eagle, Research Scientists at the U.S. Geological Survey, collects an elevation point along the edge of Quivett Creek in Brewster, MA. This salt marsh was restored in 2005 by replacing a narrow culvert to allow full tidal flow once again.

Bass Creek Salt Marsh, Yarmouth, MA
Salt marsh grass grows in the restored marsh at Bass Creek, Yarmouth, MA.
Salt marsh grass grows in the restored marsh at Bass Creek, Yarmouth, MA.

Bass Creek salt marsh, Yarmouth, MA
Two USGS scientists measure elevation at Bass Creek salt marsh, Yarmouth, MA.
Two USGS scientists measure elevation at Bass Creek salt marsh, Yarmouth, MA.

Piping Plover Nest
USGS scientists are working to model shorebird habitat availability both today and in the future, given processes like sea-level rise, in an effort to support the efficient management of beaches for both people and nesting shorebirds.
USGS scientists are working to model shorebird habitat availability both today and in the future, given processes like sea-level rise, in an effort to support the efficient management of beaches for both people and nesting shorebirds.

Four airgun arrays towed behind R/V Marcus G. Langseth.
Four airgun arrays towed behind R/V Marcus G. Langseth.Four airgun arrays towed behind R/V Marcus G. Langseth.
Four airgun arrays towed behind R/V Marcus G. Langseth.
Four airgun arrays towed behind R/V Marcus G. Langseth.Four airgun arrays towed behind R/V Marcus G. Langseth.

Barnegat Bay residence times in days
Barnegat Bay residence times in days for (a) scenario T, only tidal forcing; (b) scenario TB, combined offshore hydrodynamic forcing; (c) scenario TBR, streamflow with combined hydrodynamic forcing; and (d) scenario TBRM, full suite with meteorological forcing
Barnegat Bay residence times in days for (a) scenario T, only tidal forcing; (b) scenario TB, combined offshore hydrodynamic forcing; (c) scenario TBR, streamflow with combined hydrodynamic forcing; and (d) scenario TBRM, full suite with meteorological forcing

Deploying the 8-km long streamer from R/V Marcus G. Langseth.
Deploying the 8-km long streamer from R/V Marcus G. Langseth.Deploying the 8-km long streamer from R/V Marcus G. Langseth.
Deploying the 8-km long streamer from R/V Marcus G. Langseth.
Deploying the 8-km long streamer from R/V Marcus G. Langseth.Deploying the 8-km long streamer from R/V Marcus G. Langseth.

R/V Marcus G. Langseth in port in Charleston, SC.
R/V Marcus G. Langseth in port in Charleston, SC.
R/V Marcus G. Langseth in port in Charleston, SC.

Sandwich Town Neck Beach composite aerial view
Composite aerial view of Sandwich Town Neck Beach. The imagery was obtained from an unmanned aerial system (UAS) flown by Peter Traykovski in February, 2015, a few days after winter storm Juno. The background topography is from USGS and U.S. Army Corps of Engineers lidar data, with missing-data areas shown in white.
Composite aerial view of Sandwich Town Neck Beach. The imagery was obtained from an unmanned aerial system (UAS) flown by Peter Traykovski in February, 2015, a few days after winter storm Juno. The background topography is from USGS and U.S. Army Corps of Engineers lidar data, with missing-data areas shown in white.