
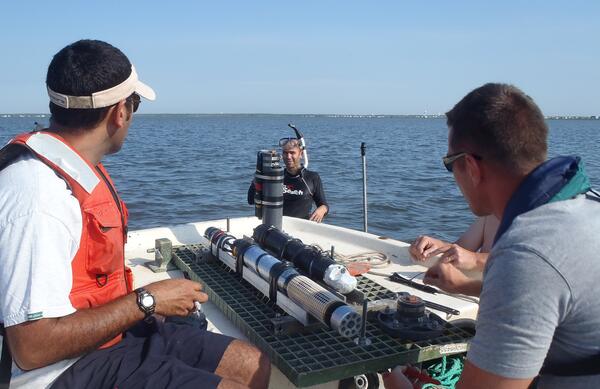
Eric Moore, Wayne Baldwin, and Tommy O’Brien are deploying multichannel seismic streamer onboard R/V Pelican during a 2013 seismic cruise in the Gulf of Mexico as part of the gas hydrates program.
Images
Woods Hole Coastal and Marine Science Center images
Filter Total Items: 1334

Deploying multichannel seismic streamer
Eric Moore, Wayne Baldwin, and Tommy O’Brien are deploying multichannel seismic streamer onboard R/V Pelican during a 2013 seismic cruise in the Gulf of Mexico as part of the gas hydrates program.

Weather buoy transport!
Sandy Brosnahan transporting a weather buoy into the Woods Hole Coastal and Marine Science Center’s operational facility to continue the process of getting it ready to deploy. This buoy was one of 6, deployed by John Warner and others, to measure wind speed, direction, pressure, and temperature off the coast of Fire Island, NY. Paired with each weather b
Sandy Brosnahan transporting a weather buoy into the Woods Hole Coastal and Marine Science Center’s operational facility to continue the process of getting it ready to deploy. This buoy was one of 6, deployed by John Warner and others, to measure wind speed, direction, pressure, and temperature off the coast of Fire Island, NY. Paired with each weather b
Shallow Water Irradience Platform placement in Barnegat Bay, NJ
Shallow Water Irradience Platform placement in Barnegat Bay, NJInvestigators prepare to place a Shallow Water Irradience Platform (SWIP) at a site in Barnegat Bay, NJ.
Shallow Water Irradience Platform placement in Barnegat Bay, NJ
Shallow Water Irradience Platform placement in Barnegat Bay, NJInvestigators prepare to place a Shallow Water Irradience Platform (SWIP) at a site in Barnegat Bay, NJ.

Salt Marsh Research
USGS research supports wetland conservation as critical habitat, Cape Cod, MA
USGS research supports wetland conservation as critical habitat, Cape Cod, MA

Equipment used for a measuring lateral fluxes over tidal cycle
Equipment used for a measuring lateral fluxes over tidal cycleEquipment used for a measuring lateral fluxes over tidal cycle
Equipment used for a measuring lateral fluxes over tidal cycle
Equipment used for a measuring lateral fluxes over tidal cycleEquipment used for a measuring lateral fluxes over tidal cycle

USGS and Summer Interns from the Partnership Education Program (PEP) p
USGS and Summer Interns from the Partnership Education Program (PEP) pUSGS and Summer Interns from the Partnership Education Program (PEP) program sampling over a tidal cycle.
USGS and Summer Interns from the Partnership Education Program (PEP) p
USGS and Summer Interns from the Partnership Education Program (PEP) pUSGS and Summer Interns from the Partnership Education Program (PEP) program sampling over a tidal cycle.

Deploying a measure flow, Rachel Carlson National Wildlife Refuge
Deploying a measure flow, Rachel Carlson National Wildlife RefugeA sensor is deployed to measure flow in a channel of the marsh in Rachel Carlson National Wildlife Refuge in 2013.
Deploying a measure flow, Rachel Carlson National Wildlife Refuge
Deploying a measure flow, Rachel Carlson National Wildlife RefugeA sensor is deployed to measure flow in a channel of the marsh in Rachel Carlson National Wildlife Refuge in 2013.

Methane Bubbles
Methane bubbles (middle top) emitted in the Norfolk seep field. Chemosynthetic mussels encrust the seafloor near the seep. The image, which is several meters across, was acquired by NOAA Office of Ocean Exploration and Research using the Deep Discoverer remotely operated vehicle in May 2013.
Methane bubbles (middle top) emitted in the Norfolk seep field. Chemosynthetic mussels encrust the seafloor near the seep. The image, which is several meters across, was acquired by NOAA Office of Ocean Exploration and Research using the Deep Discoverer remotely operated vehicle in May 2013.

Groundwater collection using a piezometer
Adrian Mann is using a piezometer to extract submarine groundwater to analyze for geochemical parameters in Indian River Bay, DE.
Adrian Mann is using a piezometer to extract submarine groundwater to analyze for geochemical parameters in Indian River Bay, DE.

Surveying program study site in the Chandeleur Islands
Surveying program study site in the Chandeleur IslandsSurveying A Barrier Island Evolution Research (BIER) program study site in the Chandeleur Islands in 2013. The survey data is used to map the pre-storm conditions.
Surveying program study site in the Chandeleur Islands
Surveying program study site in the Chandeleur IslandsSurveying A Barrier Island Evolution Research (BIER) program study site in the Chandeleur Islands in 2013. The survey data is used to map the pre-storm conditions.

Drone footage of Woods Hole Oceanographic facility
Drone footage of Woods Hole Oceanographic facilityDrone footage taken of the Woods Hole Oceanographic facility on the Quissett campus in Woods Hole Ma. This is an example of a tidally restricted marsh system cutoff from tidal flows by the bike path.

Trunk River, Woods Hole, MA
Trunk River is an example of a tidally restricted impounded wetland (Cape Cod, MA).
Trunk River is an example of a tidally restricted impounded wetland (Cape Cod, MA).
Dredge subsample
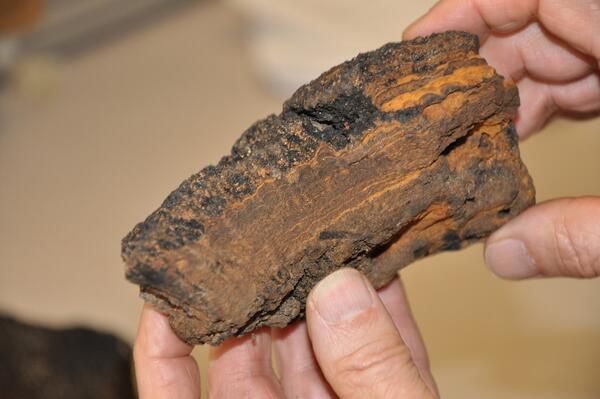
Subsample from dredge DR2-001, collected as a part of the U.S. Extended Continental Shelf Project's research in the Arctic aboard the USCGC Healy on cruise HLY1202 (Field Activity 2012-038-FA).
Subsample from dredge DR2-001, collected as a part of the U.S. Extended Continental Shelf Project's research in the Arctic aboard the USCGC Healy on cruise HLY1202 (Field Activity 2012-038-FA).

Dunes, Beach Towns and Resilience
Sand dunes in Avon on Cape Hatteras, NC are the only separation between many beach house communities and the Atlantic Ocean.
Sand dunes in Avon on Cape Hatteras, NC are the only separation between many beach house communities and the Atlantic Ocean.

Shaded relief image of Vineyard Sound MA
Shaded relief image of Vineyard Sound, MA
Shaded relief image of Vineyard Sound, MA

Seaside Heights, NJ after Hurricane Sandy
Hurricane Sandy struck the New Jersey shore October 29–31, 2012. Houses, cars, and a street in Seaside Heights, New Jersey, were covered in beach sand after the hurricane's storm tide receded
Hurricane Sandy struck the New Jersey shore October 29–31, 2012. Houses, cars, and a street in Seaside Heights, New Jersey, were covered in beach sand after the hurricane's storm tide receded

Image showing a study area from Boston Harbor to the mouth of Cape Cod
Image showing a study area from Boston Harbor to the mouth of Cape CodImage showing a study area from Boston Harbor to the mouth of Cape Cod Bay including some images of geophysical and sample data available in the associated report.

Eye of the storm!
Satellite image of Hurricane Sandy (courtesy NASA GOES http://weather.msfc.nasa.gov/GOES/)
Satellite image of Hurricane Sandy (courtesy NASA GOES http://weather.msfc.nasa.gov/GOES/)

Acoustic Backscatter Intensity
Acoustic backscatter intensity data are an indication of the relative hardness or softness of the sea floor, which is closely related to sediment texture and cohesion. The map shows acoustic backscatter intensity of the sea floor in the Buzzards Bay, Massachusetts.
Acoustic backscatter intensity data are an indication of the relative hardness or softness of the sea floor, which is closely related to sediment texture and cohesion. The map shows acoustic backscatter intensity of the sea floor in the Buzzards Bay, Massachusetts.

Gathering oyster and bed sediment samples along Long Island, NY
Gathering oyster and bed sediment samples along Long Island, NYUSGS hydrologist Kaitlyn Colella and a Shinnecock Nation member work together gathering oyster and bed sediment samples along Long Island, New York, coast.
Gathering oyster and bed sediment samples along Long Island, NY
Gathering oyster and bed sediment samples along Long Island, NYUSGS hydrologist Kaitlyn Colella and a Shinnecock Nation member work together gathering oyster and bed sediment samples along Long Island, New York, coast.

SEABOSS deployment
Left to right: Mike Bastoni (volunteer) and Lisa Engler (Massachusetts Bays Program) deploying the USGS-desgined SEABed Observation and Sampling System (SEABOSS) from Ocean Survey Vessel Bold, with Marinna Martini (USGS) running the winch
Left to right: Mike Bastoni (volunteer) and Lisa Engler (Massachusetts Bays Program) deploying the USGS-desgined SEABed Observation and Sampling System (SEABOSS) from Ocean Survey Vessel Bold, with Marinna Martini (USGS) running the winch