
Flood tidal shoal at Barnegat Inlet, New Jersey (courtesy USGS EROS NAIP orthophotography)
Images
Woods Hole Coastal and Marine Science Center images
Filter Total Items: 1334

Flood tidal shoal
Flood tidal shoal at Barnegat Inlet, New Jersey (courtesy USGS EROS NAIP orthophotography)

Collecting Samples in Barnegat Bay
Box-cores provide a relatively undistributed look into the recent past to help better understand the processes contributing to sediment deposition and erosion.
Box-cores provide a relatively undistributed look into the recent past to help better understand the processes contributing to sediment deposition and erosion.

UAS Pilot Training
USGS pilot Sandy Brosnahan and Senate Pro Tempore Marc Pacheco discuss the use of Umanned Aerial Systems (UASs, also known as drones) to collect data in coastal environments. Photo credit: Dann Blackwood, USGS.
USGS pilot Sandy Brosnahan and Senate Pro Tempore Marc Pacheco discuss the use of Umanned Aerial Systems (UASs, also known as drones) to collect data in coastal environments. Photo credit: Dann Blackwood, USGS.

Conceptual diagram used to assess potential sea-level rise impacts
Conceptual diagram used to assess potential sea-level rise impactsConceptual diagram showing the structure of the Bayesian network used to assess potential sea-level rise impacts on the coastal landscape.
Conceptual diagram used to assess potential sea-level rise impacts
Conceptual diagram used to assess potential sea-level rise impactsConceptual diagram showing the structure of the Bayesian network used to assess potential sea-level rise impacts on the coastal landscape.

Decision Making Framework
Problem statement, objectives, and alternative actions defined by Department of Interior collaborators using structured decision making framework
Problem statement, objectives, and alternative actions defined by Department of Interior collaborators using structured decision making framework

Illustration of the NIMBBLE (New instrument for making bottom boun
Illustration of the NIMBBLE (New instrument for making bottom bounIllustration of the NIMBBLE (New instrument for making bottom boundary layer evaluations). The NIMBBLE is a low-profile platform with two acoustic Doppler velocimeters and an upward-looking acoustic Doppler profilers.

Deploying multibeam sonar
USGS staff and the ship's crew of the R/V Sharp prepare to deploy a deep-water multibeam echosounder during a mapping program in the mid-Atlantic in 2015.
USGS staff and the ship's crew of the R/V Sharp prepare to deploy a deep-water multibeam echosounder during a mapping program in the mid-Atlantic in 2015.

Science crew aboard R/V Marcus G. Langseth.
Science crew aboard R/V Marcus G. Langseth. Ray Sliter (Pacific Coastal and Marine Science Center) and Deb Hutchison (Woods Hole Coastal and Marine Science Center) shown at far left.
Science crew aboard R/V Marcus G. Langseth. Ray Sliter (Pacific Coastal and Marine Science Center) and Deb Hutchison (Woods Hole Coastal and Marine Science Center) shown at far left.

South Atlantic Coast
Vector Shorelines and Associated Shoreline Change Data for the Southeast Atlantic Coast
Vector Shorelines and Associated Shoreline Change Data for the Southeast Atlantic Coast

Hudson Shelf Valley Study Site
Bathymetry and backscatter intensity of the sea floor of the Hudson Shelf Valley location map
Bathymetry and backscatter intensity of the sea floor of the Hudson Shelf Valley location map

North Atlantic Landscape Conservation Cooperative region
North Atlantic Landscape Conservation Cooperative regionCoastal area within the North Atlantic Landscape Conservation Cooperative region for which predictions have been generated.
North Atlantic Landscape Conservation Cooperative region
North Atlantic Landscape Conservation Cooperative regionCoastal area within the North Atlantic Landscape Conservation Cooperative region for which predictions have been generated.
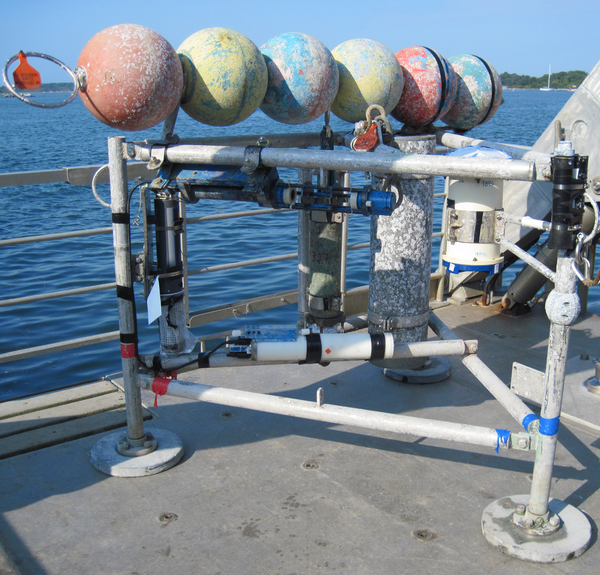
Minipod style tripod for near bottom current and wave measurements
Minipod style tripod for near bottom current and wave measurementsMinipod style tripod for near bottom current and wave measurements ready for deployment.
Minipod style tripod for near bottom current and wave measurements
Minipod style tripod for near bottom current and wave measurementsMinipod style tripod for near bottom current and wave measurements ready for deployment.

Special Delivery
Sandy Brosnahan transporting a weather buoy into the Woods Hole Coastal and Marine Science Center’s operational facility in preparation for deployment. This buoy was one of 6 deployed to measure wind speed, direction, pressure, and temperature off the coast of Fire Island, NY.
Sandy Brosnahan transporting a weather buoy into the Woods Hole Coastal and Marine Science Center’s operational facility in preparation for deployment. This buoy was one of 6 deployed to measure wind speed, direction, pressure, and temperature off the coast of Fire Island, NY.

Juncus Marsh
Photograph of a Juncus marsh in the Tampa Bay estuary, Florida.
Photograph of a Juncus marsh in the Tampa Bay estuary, Florida.

View from Sandwich beach cam
A view from the beach cam on Christmas Day 2015 shows tugs and barges working to install the sand delivery pipe.
A view from the beach cam on Christmas Day 2015 shows tugs and barges working to install the sand delivery pipe.

Breaking waves, Marshall Islands
Waves breaking over offshore reefs on Kwajalein Atoll, in the Marshall Islands, where reefs are protecting developed land from flooding.
Waves breaking over offshore reefs on Kwajalein Atoll, in the Marshall Islands, where reefs are protecting developed land from flooding.

Mounted beach camera
Chris Sherwood poses below the Sandwich beach camera. The white box contains a small uninterrupted power supply.
Chris Sherwood poses below the Sandwich beach camera. The white box contains a small uninterrupted power supply.

Using GPS rover system
USGS technician Barry Irwin uses a GPS rover system to locate one of the targets used to calibrate the field of view for the beach cam. Three other larger targets are visible in the background.
USGS technician Barry Irwin uses a GPS rover system to locate one of the targets used to calibrate the field of view for the beach cam. Three other larger targets are visible in the background.

Photo marked with squares for pixel coordinates
Image from the beach cam with targets used to calibrate the images, allowing researchers to use pixel coordinates in the images to determine real-world locations.
Image from the beach cam with targets used to calibrate the images, allowing researchers to use pixel coordinates in the images to determine real-world locations.

Aerial image showing beach and offshore reef
Aerial image showing beach and offshore reef
Aerial image showing beach and offshore reef

Aerial image showing beach and offshore reef
Aerial image showing beach and offshore reef
Aerial image showing beach and offshore reef