
GeoGirls 2019 group photo, with Mount St. Helens in the background.
Images
Images
Filter Total Items: 9454

GeoGirls 2019 Group Photo
GeoGirls 2019 group photo, with Mount St. Helens in the background.

GeoGirls Hike to Willow Creek
GeoGirls hike to Willow Creek, on Mount St. Helens’ Pumice Plain, to learn more about the ecology of the blast zone and how the area has recovered since the catastrophic May 18, 1980, eruption. Here, they look at stream characteristics and how it has influenced the return of life to the area.
GeoGirls hike to Willow Creek, on Mount St. Helens’ Pumice Plain, to learn more about the ecology of the blast zone and how the area has recovered since the catastrophic May 18, 1980, eruption. Here, they look at stream characteristics and how it has influenced the return of life to the area.

The GeoGirls Create Field Drawings
The GeoGirls create field drawings of 1980 pyroclastic flow deposits on Mount St. Helens’ Pumice Plain.
The GeoGirls create field drawings of 1980 pyroclastic flow deposits on Mount St. Helens’ Pumice Plain.

GeoGirls Hike the Pumice Plain at Mount St. Helens
GeoGirls Hike the Pumice Plain at Mount St. HelensThe GeoGirls hike the Pumice Plain at Mount St. Helens, examining lava outcrops and volcanic sediment.
GeoGirls Hike the Pumice Plain at Mount St. Helens
GeoGirls Hike the Pumice Plain at Mount St. HelensThe GeoGirls hike the Pumice Plain at Mount St. Helens, examining lava outcrops and volcanic sediment.

GeoGirls Venture into Ape Cave
GeoGirls venture into Ape Cave, a 2,000-year-old lava tube on the south flank of Mount St. Helens, as they learn about Mount St. Helens’ eruptive history and lava flows.
GeoGirls venture into Ape Cave, a 2,000-year-old lava tube on the south flank of Mount St. Helens, as they learn about Mount St. Helens’ eruptive history and lava flows.

GeoGirls Venture into Ape Cave II
GeoGirls venture into Ape Cave, a 2,000-year-old lava tube on the south flank of Mount St. Helens, as they learn about Mount St. Helens’ eruptive history and lava flows.
GeoGirls venture into Ape Cave, a 2,000-year-old lava tube on the south flank of Mount St. Helens, as they learn about Mount St. Helens’ eruptive history and lava flows.

USGS scientists installed a thermal imaging camera on a streamgage
USGS scientists installed a thermal imaging camera on a streamgageUSGS scientists installed a thermal imaging camera on a current USGS streamgage on the Neversink River near Claryville, New York. This equipment will help monitor surface water temperatures and can help understand the amount of groundwater contributing to surface runoff.

Bandera water supply tower
Southwest-oriented view of the Bandera water supply tower near the Bandera County Courthouse, Bandera, Texas, December 2018 (photograph by Frank L. Engel, U.S. Geological Survey).
SIR 2019-5067
Southwest-oriented view of the Bandera water supply tower near the Bandera County Courthouse, Bandera, Texas, December 2018 (photograph by Frank L. Engel, U.S. Geological Survey).
SIR 2019-5067
Medina River near State Route 16 in Bandera
West-oriented view of the Medina River looking upstream near State Route 16 in Bandera, Texas, December 2018 (photograph by Frank L. Engel, U.S. Geological Survey).
SIR 2019-5067
West-oriented view of the Medina River looking upstream near State Route 16 in Bandera, Texas, December 2018 (photograph by Frank L. Engel, U.S. Geological Survey).
SIR 2019-5067

USGS surveys for piping plovers
Two USGS research technicians walk across a sparsely vegetated sandbar towards the Missouri River while surveying for piping plovers.
Two USGS research technicians walk across a sparsely vegetated sandbar towards the Missouri River while surveying for piping plovers.

Sediment Core
USGS scientist Jessica Rodysill studies a sediment core to identify storm deposits and help understand past hurricane activity. This core was collected from the Dominican Republic. Credit: Kristen Steele, USGS.
USGS scientist Jessica Rodysill studies a sediment core to identify storm deposits and help understand past hurricane activity. This core was collected from the Dominican Republic. Credit: Kristen Steele, USGS.

2019 Ridgecrest Earthquake Sequence: July 4, 2019–July 16, 2019
2019 Ridgecrest Earthquake Sequence: July 4, 2019–July 16, 20193,557 earthquakes recorded since July 4, 2019 above Magnitude 2
M6.4 12km W of Searles Valley, CA
2019-07-04 17:33:49 (UTC)
51,000+ responses via Did You Feel It?
M7.1 18km W of Searles Valley, CA
2019-07-06 03:19:53 (UTC)
42,000+ responses via Did You Feel It?
Barry's wave, surge likely to affect beaches in four states
Barry's wave, surge likely to affect beaches in four statesThis Coastal Change Storm Hazard Team map was created Friday, July 12, 2019 and shows forecast beach erosion (the strip of colored bars closest to the coast), overwash (middle strip) and inundation (outer strip) effects of Tropical Storm Barry’s predicted landfall in Louisiana.
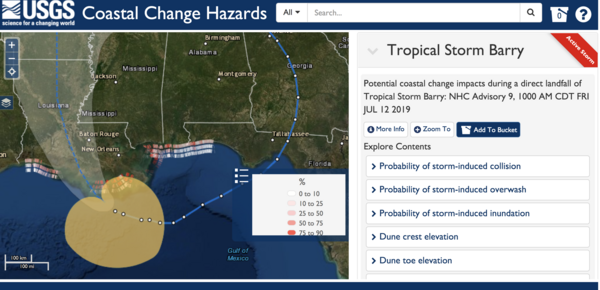

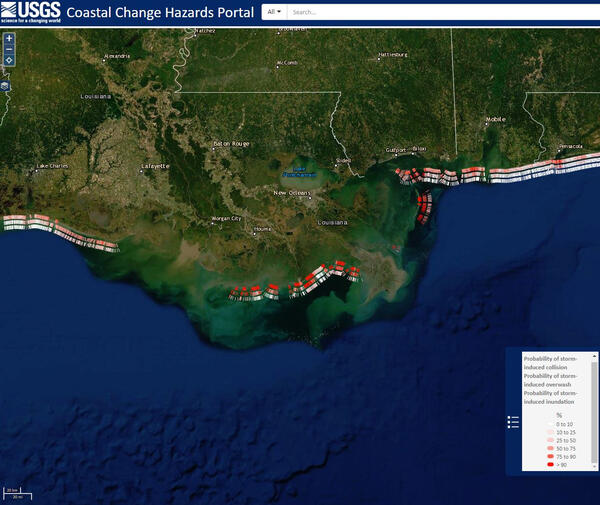
These Gulf beaches are forecast to be affected by Barry
These Gulf beaches are forecast to be affected by BarryThis Coastal Change Storm Hazard Team map was created Thursday, July 11, 2019 and shows forecast beach erosion (the strip of colored bars closest to the coast), overwash (middle strip) and inundation (outer strip) effects of Tropical Storm Barry’s predicted landfall in Louisiana.

Barry forecast to affect beaches in four Gulf states
Barry forecast to affect beaches in four Gulf statesThis Coastal Change Storm Hazard Team map was created Thursday, July 11, 2019 and shows forecast beach erosion (the strip of colored bars closest to the coast), overwash (middle strip) and inundation (outer strip) effects of Tropical Storm Barry’s predicted landfall in Louisiana.

USGS provides briefing to Navy about Ridgecrest Earthquake Sequence
USGS provides briefing to Navy about Ridgecrest Earthquake SequenceKate Scharer (USGS) provides CO CAPT Paul Dale (Navy) with the field mapping team’s initial product, showing the surface fault rupture at NAWSCL as well as the temporarily deployed seismic and GPS sensors that were rapidly deployed. Contributions of field data from within the base were from CGS & USGS, and from outside the base were from Univ.

Portable Seismic Station
Two portable sensors: a strong motion sensor (to record strong shaking that can be felt) and a broadband sensor (to record weak motion for detecting small earthquakes) buried into the ground to detect earthquakes. These stations can be quickly deployed and send real-time data back to the USGS via cellular telemetry immediately after they are installed.
Two portable sensors: a strong motion sensor (to record strong shaking that can be felt) and a broadband sensor (to record weak motion for detecting small earthquakes) buried into the ground to detect earthquakes. These stations can be quickly deployed and send real-time data back to the USGS via cellular telemetry immediately after they are installed.

USGS provides briefing to Navy about Ridgecrest Earthquake Sequence
USGS provides briefing to Navy about Ridgecrest Earthquake SequenceKate Scharer (USGS) provides CO CAPT Paul Dale (Navy) with the field mapping team’s initial product, showing the surface fault rupture at NAWSCL as well as the temporarily deployed seismic and GPS sensors that were rapidly deployed. Contributions of field data from within the base were from CGS & USGS, and from outside the base were from Univ.

Northern end of rupture resulting from the M7.1 Searles Valley quake
Northern end of rupture resulting from the M7.1 Searles Valley quakeFault rupture crosses dirt road, with California Geologial Survey vehicles for scale. Displacement at this location is primarily normal (vertical). Photograph taken near the northern end of the rupture resulting from the M7.1 Searles Valley earthquake.

Surface faulting from the M7.1 Searles Valley earthquake
Surface faulting from the M7.1 Searles Valley earthquakeOblique photograph showing surface faulting from the M7.1 Searles Valley earthquake. The dirt track (center) is right-laterally offset approximately 2.5 m (~8 ft).
Surface faulting from the M7.1 Searles Valley earthquake
Surface faulting from the M7.1 Searles Valley earthquakeOblique photograph showing surface faulting from the M7.1 Searles Valley earthquake. The dirt track (center) is right-laterally offset approximately 2.5 m (~8 ft).