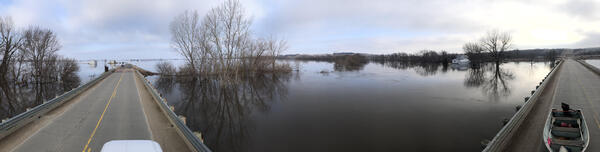
U.S. flag

An official website of the United States government

Images

Images

Filter Total Items: 9443
Lidar point cloud, Pre-Hurricane PR, rotate and zoom

Figure 3: Zooming in and rotating scene in 3D from figure 2. Points coloer by laser intensity (blue = low intensity, red = high intensity).

severely damaged, cracked road at top of debris flow
Debris flow road damage - Polk County, NC

Heavy rainfall reactivated the 9 acre Howard Gap Landslide in February 2019, severely damaging a highway in Polk County, NC. This image only shows a small portion of a much larger landslide.

Heavy rainfall reactivated the 9 acre Howard Gap Landslide in February 2019, severely damaging a highway in Polk County, NC. This image only shows a small portion of a much larger landslide.

USGS scientists prepare for fieldwork in Florida Bay
Preparing for fieldwork in Florida Bay

Conducting field work after Hurricane Irma on Bob Allen Key in Florida Bay, Everglades National Park, January 29, 2018. Lynn Wingard (left) and Miriam Jones (right) consult field notes from 2014 to decide where to take samples. Photo: B. Stackhouse, USGS

Conducting field work after Hurricane Irma on Bob Allen Key in Florida Bay, Everglades National Park, January 29, 2018. Lynn Wingard (left) and Miriam Jones (right) consult field notes from 2014 to decide where to take samples. Photo: B. Stackhouse, USGS

Image: Landsat Ice Caps
Landsat Ice Caps
Landsat Ice Caps
Landsat Ice Caps

Landsat image of ice caps in northern Savernaya Zemlya, Russian Arctic Islands (80 degrees N.). The scene shows zones of melting on the ice caps. The largest ice cap is about 80 km across. Image courtesy of Julian Dowdeswell, Scott Polar Research Institute, Cambridge, UK.

Landsat image of ice caps in northern Savernaya Zemlya, Russian Arctic Islands (80 degrees N.). The scene shows zones of melting on the ice caps. The largest ice cap is about 80 km across. Image courtesy of Julian Dowdeswell, Scott Polar Research Institute, Cambridge, UK.

A USGS technician services a ShakeAlert sensor station in the San Francisco Bay area
ShakeAlert sensor station being serviced by USGS personnel

A USGS electronics technician performs maintenance on a ShakeAlert Earthquake Early Warning (EEW) sensor station, located in the San Francisco Bay Area. ShakeAlert station components include strong-motion accelerometers, solar panel and battery power systems, and communications & telemetry equipment for communication with the wider ShakeAlert network. 

A USGS electronics technician performs maintenance on a ShakeAlert Earthquake Early Warning (EEW) sensor station, located in the San Francisco Bay Area. ShakeAlert station components include strong-motion accelerometers, solar panel and battery power systems, and communications & telemetry equipment for communication with the wider ShakeAlert network. 

Brown landscape with volcano in the background
Mount Shasta, a steep-sided Cascade Range stratovolcano in Northern Ca

Mount Shasta, a steep-sided Cascade Range stratovolcano in Northern California, looms above Little Glass Mountain, a thick obsidian flow erupted from the Medicine Lake shield volcano about 1,000 years ago. These are just two of the young volcanic areas monitored by the USGS California Volcano Observatory. USGS photo.

Mount Shasta, a steep-sided Cascade Range stratovolcano in Northern California, looms above Little Glass Mountain, a thick obsidian flow erupted from the Medicine Lake shield volcano about 1,000 years ago. These are just two of the young volcanic areas monitored by the USGS California Volcano Observatory. USGS photo.

A spotted lizard shaped animal with red, frilly gills at the base of its head is in shallow water
Gulf Coast Waterdog - Necturus beyeri

Source: USGS National Wetlands Research Center. Photographer: Brad M. Glorioso. St. Tammany Parish, Louisiana

Necturus beyeri - Gulf Coast Waterdog

Source: USGS National Wetlands Research Center. Photographer: Brad M. Glorioso. St. Tammany Parish, Louisiana

Necturus beyeri - Gulf Coast Waterdog

A dark salamander with bright blue spots rest on a moss-covered log
Blue spotted salamander

Eastern Iowa Ambystoma laterale - Blue-spotted Salamander. USGS ARMI photo by Evan S. Grimes

Eastern Iowa Ambystoma laterale - Blue-spotted Salamander. USGS ARMI photo by Evan S. Grimes

Gentleman working with Early Earthquake Warning Sensors
B-Roll: California ShakeAlert Sensor

Maintenance of high quality ShakeAlert sensor, power and telemetry station in the San Francisco Bay Area in California.

Maintenance of high quality ShakeAlert sensor, power and telemetry station in the San Francisco Bay Area in California.

scientist Miriam Jones holds a peat core in a bog
Miriam Jones holds a peat core in Alaska

Miriam Jones holding a peat core that was extracted from a thawed permafrost bog at the Alaska Permafrost Experiment (APEX) site at Bonanza Creek LTER, Alaska. The boundary between the formerly frozen permafrost plateau and thawed bog is visible in the peat stratigraphy, with the light-colored peat indicated thawed bog.

Miriam Jones holding a peat core that was extracted from a thawed permafrost bog at the Alaska Permafrost Experiment (APEX) site at Bonanza Creek LTER, Alaska. The boundary between the formerly frozen permafrost plateau and thawed bog is visible in the peat stratigraphy, with the light-colored peat indicated thawed bog.

Map of AK showing probability of change occurrence

Map of Alaska showing probability (%) of change occurrence. Insets show fire boundaries from the Bureau of Land Management (BLM) Large Fire Database and Landsat 8 imagery (bottom right; 2016) north of Fairbanks, Alaska.

city skyline at night with tall buildings and bridge in left foreground lit up
The Bay Bridge and the Oakland city skyline

The nighttime Oakland city skyline as seen from San Francisco with the Bay Bridge in the foreground

Map showing the locations of all U.S. volcanoes
Map of volcano threat category designated by color

Map showing the locations of all U.S. volcanoes with their threat category designated by color. Very high threat is red, high is orange, moderate is yellow, low is green, and very low is blue. 

Map showing the locations of all U.S. volcanoes with their threat category designated by color. Very high threat is red, high is orange, moderate is yellow, low is green, and very low is blue. 

Satellite photos of Cape San Blas, Florida before and after Hurricane Michael
Cape San Blas Road, before and after a Category 5 hurricane

These two NOAA satellite images show Cape San Blas Road in the Florida Panhandle town of Cape San Blas before Hurricane Michael, and after the Category 5 storm. The red circle shows where the USGS sea turtle researchers' field station and seasonal home once stood. The building was demolished down to the concrete slab.

These two NOAA satellite images show Cape San Blas Road in the Florida Panhandle town of Cape San Blas before Hurricane Michael, and after the Category 5 storm. The red circle shows where the USGS sea turtle researchers' field station and seasonal home once stood. The building was demolished down to the concrete slab.

two otters - a baby and mom - relax on their backs in Glacier Bay, AK
Otter mom feed pup in Glacier Bay, AK

A sea otter mother feeds her pup in Glacier Bay, Alaska. USGS researchers study sea otter distribution and abundance in Alaska and other parts of the country.

A sea otter mother feeds her pup in Glacier Bay, Alaska. USGS researchers study sea otter distribution and abundance in Alaska and other parts of the country.

Gentleman setting up early earthquake warning sensors
B-Roll: Northwest ShakeAlert Sensor Station

Maintenance of a high-quality ShakeAlert sensors, power and telemetry stations in Portland, OR.

Beige, dusty trails filled with grey-ish shrubs that were touched by fire. Rolling hills in the background
El Escorpión Park
El Escorpión Park
El Escorpión Park

Chaparral in the foreground of the El Escorpión Park in Southern California after the November 2018 Woolsey fire. Photo taken in December 2018. 

Chaparral in the foreground of the El Escorpión Park in Southern California after the November 2018 Woolsey fire. Photo taken in December 2018. 

HVO geologist Matthew Patrick being interviewed on the Kīlauea lava...
Geologist Matthew Patrick being interviewed on the Kīlauea lava-flo...

HVO geologist Matthew Patrick being interviewed on the Kīlauea lava-flow field for a documentary about Hawaiian volcanism. Growing lava delta (left background) steaming at the point of ocean entry.

USGS scientists collect sediment cores from Lake Powell

USGS scientists collect sediment cores to examine the amount and distribution of metals within Lake Powell.  

Was this page helpful?