
In 1938, after a brush fire, a rancher found remnants of the Nellie Powell, a boat from Powell’s second expedition in 1871, which had been left at Lees Ferry. Grand Canyon National Park now stores this piece in its collections. (Annie Scott/USGS)
Images
Images
Filter Total Items: 9449

Nellie Powell - Powell Boat 1871
In 1938, after a brush fire, a rancher found remnants of the Nellie Powell, a boat from Powell’s second expedition in 1871, which had been left at Lees Ferry. Grand Canyon National Park now stores this piece in its collections. (Annie Scott/USGS)

Grand Canyon National Park Historic River Boat Collection
Grand Canyon National Park Historic River Boat CollectionThe Edith (left), in Grand Canyon National Park’s historic river boat collection, is an example of a wooden river boat, though it was made from several decades after Powell’s expedition. Brothers Emery and Ellsworth Kolb paddled it down the Colorado River in 1911-12.

Measuring high flows in Fargo, ND
An instrument called an acoustic Doppler current profiler (ADCP) takes streamflow measurements during flooding. The ADCP is attached to a buoy that is dragged in the water either alongside a boat or by hand. USGS hydrologist Dan Thomas points to the ADCP sensor on the Red River of the North during flooding in downtown Fargo, ND.
An instrument called an acoustic Doppler current profiler (ADCP) takes streamflow measurements during flooding. The ADCP is attached to a buoy that is dragged in the water either alongside a boat or by hand. USGS hydrologist Dan Thomas points to the ADCP sensor on the Red River of the North during flooding in downtown Fargo, ND.

Measuring floodwater in Fargo, ND
A USGS crew measures flooding on the Red River in downtown Fargo, North Dakota. The orange instrument is an acoustic Doppler current profiler, which is used to measure streamflow as it's pulled across the water.
A USGS crew measures flooding on the Red River in downtown Fargo, North Dakota. The orange instrument is an acoustic Doppler current profiler, which is used to measure streamflow as it's pulled across the water.

Measuring flooding in downtown Fargo, ND
USGS hydrologist Dan Thomas prepares to measure record flows on the Red River of the North in downtown Fargo, North Dakota. The orange instrument is an acoustic Doppler current profiler, which is used to measure streamflow as it's pulled across the water.
USGS hydrologist Dan Thomas prepares to measure record flows on the Red River of the North in downtown Fargo, North Dakota. The orange instrument is an acoustic Doppler current profiler, which is used to measure streamflow as it's pulled across the water.

Measuring high flows, Maple River, ND
A USGS crew measures high flow during flooding on the Maple River near Mapleton, North Dakota. The instrument being pulled across the water is an acoustic Doppler current profiler, which is used to measure streamflow. The truck is parked on a road that had been overtaken by the river.
A USGS crew measures high flow during flooding on the Maple River near Mapleton, North Dakota. The instrument being pulled across the water is an acoustic Doppler current profiler, which is used to measure streamflow. The truck is parked on a road that had been overtaken by the river.

Taking streamflow measurements during flooding in ND
Taking streamflow measurements during flooding in NDA USGS crew prepares to measure streamflow during record flooding on the Maple River near Mapleton, ND, on April 6, 2019. The instrument pictured is an acoustic Doppler current profiler which measures streamflow as it's dragged across the water.

Spring 2019 Flooding - Red River of the North in North Dakota
Spring 2019 Flooding - Red River of the North in North DakotaTwo USGS technicians observe water measurements from a boat with flooding in the background during record Midwest flooding in spring 2019.
Spring 2019 Flooding - Red River of the North in North Dakota
Spring 2019 Flooding - Red River of the North in North DakotaTwo USGS technicians observe water measurements from a boat with flooding in the background during record Midwest flooding in spring 2019.

Spring 2019 Flooding - Red River of the North in North Dakota
Spring 2019 Flooding - Red River of the North in North DakotaA USGS technician steers a watercraft with floodwaters in the background during record Midwest flooding in spring 2019.
Spring 2019 Flooding - Red River of the North in North Dakota
Spring 2019 Flooding - Red River of the North in North DakotaA USGS technician steers a watercraft with floodwaters in the background during record Midwest flooding in spring 2019.

Measuring flooding on the Maple River, ND
A USGS crew measures high flow during flooding on the Maple River near Mapleton, North Dakota. The yellow instrument is an acoustic Doppler current profiler, which is used to measure streamflow as it's pulled across the water. The crew is standing on a road that had been overtaken by the river.
A USGS crew measures high flow during flooding on the Maple River near Mapleton, North Dakota. The yellow instrument is an acoustic Doppler current profiler, which is used to measure streamflow as it's pulled across the water. The crew is standing on a road that had been overtaken by the river.

Measuring high water flow on the Maple River, ND
This is not a lake! A USGS crew measures high flow during flooding on the Maple River near Mapleton, North Dakota. The instrument being pulled across the water is an acoustic Doppler current profiler (ADCP), which is used to measure streamflow.
This is not a lake! A USGS crew measures high flow during flooding on the Maple River near Mapleton, North Dakota. The instrument being pulled across the water is an acoustic Doppler current profiler (ADCP), which is used to measure streamflow.

Taking streamflow measurements in ND
A USGS crew measures streamflow during record flooding on the Red River of the North near Georgetown, ND, on April 6, 2019. The apparatus in the middle of the image is a USGS temporary streamgage installed to monitor flooding, and the orange instrument pictured is an acoustic Doppler current profiler that measures streamflow.
A USGS crew measures streamflow during record flooding on the Red River of the North near Georgetown, ND, on April 6, 2019. The apparatus in the middle of the image is a USGS temporary streamgage installed to monitor flooding, and the orange instrument pictured is an acoustic Doppler current profiler that measures streamflow.

Spring 2019 Flooding - Wild Rice River in Minnesota
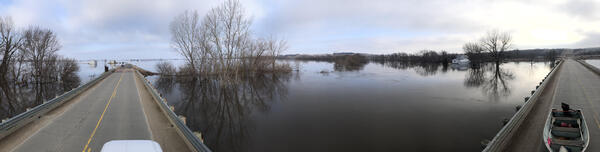
Spring 2019 Flooding - Wild Rice River in MinnesotaWWG Reading on the Wild Rice River in Minnesota during record Midwest flooding in spring 2019.
Spring 2019 Flooding - Wild Rice River in Minnesota
Spring 2019 Flooding - Wild Rice River in MinnesotaWWG Reading on the Wild Rice River in Minnesota during record Midwest flooding in spring 2019.
Spring 2019 Flooding - Maple River in North Dakota
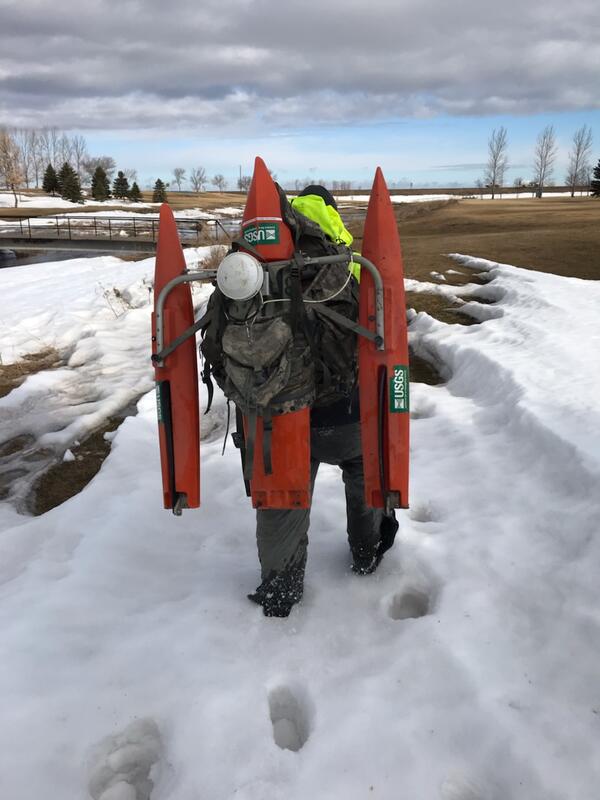
Spring 2019 Flooding - Maple River in North DakotaA USGS technician walks through snowy terrain carrying an ADCP device on his back during record Midwest flooding in spring 2019.
Spring 2019 Flooding - Maple River in North Dakota
Spring 2019 Flooding - Maple River in North DakotaA USGS technician walks through snowy terrain carrying an ADCP device on his back during record Midwest flooding in spring 2019.

USGS crews respond to flooding on the Big Sioux River
USGS crews respond to flooding on the Big Sioux RiverUSGS scientists and technicians took water measurements during flooding on the Big Sioux River near Hawarden, Iowa in March 2019.
USGS crews respond to flooding on the Big Sioux River
USGS crews respond to flooding on the Big Sioux RiverUSGS scientists and technicians took water measurements during flooding on the Big Sioux River near Hawarden, Iowa in March 2019.

USGS crews respond to flooding on the Big Sioux River
USGS crews respond to flooding on the Big Sioux RiverUSGS technician Chris Broz helps take water measurements on the Big Sioux River during record flooding in March, 2019.
USGS crews respond to flooding on the Big Sioux River
USGS crews respond to flooding on the Big Sioux RiverUSGS technician Chris Broz helps take water measurements on the Big Sioux River during record flooding in March, 2019.

Spring 2019 Flooding - Big Sioux River, Akron, IA
After record flooding on the Big Sioux River, USGS crews mobilized to take important water measurements.
After record flooding on the Big Sioux River, USGS crews mobilized to take important water measurements.

Spring 2019 Flooding - Big Sioux River
After record flooding on the Big Sioux River, USGS crews mobilized to take important water measurements.
After record flooding on the Big Sioux River, USGS crews mobilized to take important water measurements.

USGS crews respond to flooding on the Big Sioux River
USGS crews respond to flooding on the Big Sioux RiverUSGS technician Chris Broz helps take water measurements on the Big Sioux River during record flooding in March, 2019.
USGS crews respond to flooding on the Big Sioux River
USGS crews respond to flooding on the Big Sioux RiverUSGS technician Chris Broz helps take water measurements on the Big Sioux River during record flooding in March, 2019.
USGS takes water measurements during Big Sioux flooding
USGS takes water measurements during Big Sioux floodingUSGS scientists and technicians took water measurements during flooding on the Big Sioux River near Jefferson, SD in March 2019. Measurements for this site were 52,000 cfs at a gage height of 40.14 ft.

Spring 2019 Flooding - Big Sioux River
After record flooding on the Big Sioux River, USGS crews mobilized to take important water measurements.
After record flooding on the Big Sioux River, USGS crews mobilized to take important water measurements.