
Six Mile Falls on Kenduskeag Stream at USGS station 01037000.
Images
Images
Filter Total Items: 9454

Kenduskeag Stream
Six Mile Falls on Kenduskeag Stream at USGS station 01037000.

Tipping trees on top of permafrost in Innoko National Wildlife Refuge, AK
Tipping trees on top of permafrost in Innoko National Wildlife Refuge, AKCaption: Trees tipping over and dying as ice-rich permafrost thaws in the Innoko National Wildlife Refuge, Alaska.
Tipping trees on top of permafrost in Innoko National Wildlife Refuge, AK
Tipping trees on top of permafrost in Innoko National Wildlife Refuge, AKCaption: Trees tipping over and dying as ice-rich permafrost thaws in the Innoko National Wildlife Refuge, Alaska.

Map of volcano threat category designated by color
Map of volcano threat category designated by colorMap showing the locations of all U.S. volcanoes with their threat category designated by color. Very high threat is red, high is orange, moderate is yellow, low is green, and very low is blue.
Map of volcano threat category designated by color
Map of volcano threat category designated by colorMap showing the locations of all U.S. volcanoes with their threat category designated by color. Very high threat is red, high is orange, moderate is yellow, low is green, and very low is blue.

Cape San Blas Road, before and after a Category 5 hurricane
Cape San Blas Road, before and after a Category 5 hurricaneThese two NOAA satellite images show Cape San Blas Road in the Florida Panhandle town of Cape San Blas before Hurricane Michael, and after the Category 5 storm. The red circle shows where the USGS sea turtle researchers' field station and seasonal home once stood. The building was demolished down to the concrete slab.

Landsat Ice Caps
Landsat image of ice caps in northern Savernaya Zemlya, Russian Arctic Islands (80 degrees N.). The scene shows zones of melting on the ice caps. The largest ice cap is about 80 km across. Image courtesy of Julian Dowdeswell, Scott Polar Research Institute, Cambridge, UK.
Landsat image of ice caps in northern Savernaya Zemlya, Russian Arctic Islands (80 degrees N.). The scene shows zones of melting on the ice caps. The largest ice cap is about 80 km across. Image courtesy of Julian Dowdeswell, Scott Polar Research Institute, Cambridge, UK.

ShakeAlert sensor station being serviced by USGS personnel
ShakeAlert sensor station being serviced by USGS personnelA USGS electronics technician performs maintenance on a ShakeAlert Earthquake Early Warning (EEW) sensor station, located in the San Francisco Bay Area. ShakeAlert station components include strong-motion accelerometers, solar panel and battery power systems, and communications & telemetry equipment for communication with the wider ShakeAlert network.

Mount Shasta, a steep-sided Cascade Range stratovolcano in Northern Ca
Mount Shasta, a steep-sided Cascade Range stratovolcano in Northern CaMount Shasta, a steep-sided Cascade Range stratovolcano in Northern California, looms above Little Glass Mountain, a thick obsidian flow erupted from the Medicine Lake shield volcano about 1,000 years ago. These are just two of the young volcanic areas monitored by the USGS California Volcano Observatory. USGS photo.

Gulf Coast Waterdog - Necturus beyeri
Source: USGS National Wetlands Research Center. Photographer: Brad M. Glorioso. St. Tammany Parish, Louisiana
Necturus beyeri - Gulf Coast Waterdog
Source: USGS National Wetlands Research Center. Photographer: Brad M. Glorioso. St. Tammany Parish, Louisiana
Necturus beyeri - Gulf Coast Waterdog

Blue spotted salamander
Eastern Iowa Ambystoma laterale - Blue-spotted Salamander. USGS ARMI photo by Evan S. Grimes
Eastern Iowa Ambystoma laterale - Blue-spotted Salamander. USGS ARMI photo by Evan S. Grimes

B-Roll: California ShakeAlert Sensor
Maintenance of high quality ShakeAlert sensor, power and telemetry station in the San Francisco Bay Area in California.
Maintenance of high quality ShakeAlert sensor, power and telemetry station in the San Francisco Bay Area in California.
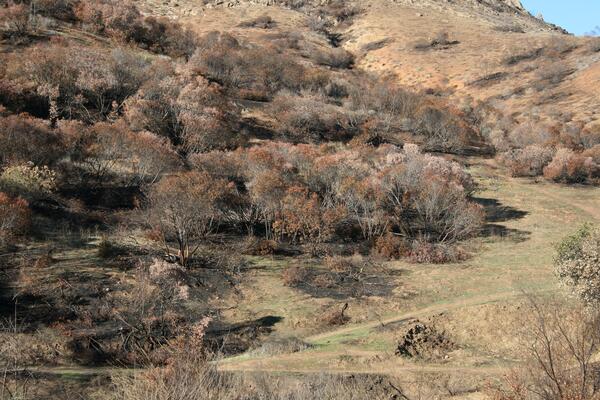
El Escorpión Park
Chaparral in the foreground of the El Escorpión Park in Southern California after the November 2018 Woolsey fire. Photo taken in December 2018.
Chaparral in the foreground of the El Escorpión Park in Southern California after the November 2018 Woolsey fire. Photo taken in December 2018.

Geologist Matthew Patrick being interviewed on the Kīlauea lava-flo...
Geologist Matthew Patrick being interviewed on the Kīlauea lava-flo...HVO geologist Matthew Patrick being interviewed on the Kīlauea lava-flow field for a documentary about Hawaiian volcanism. Growing lava delta (left background) steaming at the point of ocean entry.

USGS scientists collect sediment cores from Lake Powell
USGS scientists collect sediment cores from Lake PowellUSGS scientists collect sediment cores to examine the amount and distribution of metals within Lake Powell.
USGS scientists collect sediment cores from Lake Powell
USGS scientists collect sediment cores from Lake PowellUSGS scientists collect sediment cores to examine the amount and distribution of metals within Lake Powell.

Drill rig to collect sediment samples on Lake Powell.
Drill rig to collect sediment samples on Lake Powell.Drill rig to collect sediment samples on Lake Powell.
Drill rig to collect sediment samples on Lake Powell.
Drill rig to collect sediment samples on Lake Powell.Drill rig to collect sediment samples on Lake Powell.

USGS scientists collect sediment cores on Lake Powell
USGS scientists collect sediment cores on Lake PowellUSGS scientists work with heavy machinery to collect sediment through the full thickness of the San Juan and Colorado River deltas.
USGS scientists collect sediment cores on Lake Powell
USGS scientists collect sediment cores on Lake PowellUSGS scientists work with heavy machinery to collect sediment through the full thickness of the San Juan and Colorado River deltas.

USGS scientists process sediment cores on Lake Powell
USGS scientists process sediment cores on Lake PowellCore processing hut provides a sheltered environment for scientists to process the cores for shipment to the National Lacustrine Core Facility
USGS scientists process sediment cores on Lake Powell
USGS scientists process sediment cores on Lake PowellCore processing hut provides a sheltered environment for scientists to process the cores for shipment to the National Lacustrine Core Facility

USGS scientists collect sediment cores on Lake Powell
USGS scientists collect sediment cores on Lake PowellUSGS scientists collect sediment cores to examine the amount and distribution of metals within Lake Powell.
USGS scientists collect sediment cores on Lake Powell
USGS scientists collect sediment cores on Lake PowellUSGS scientists collect sediment cores to examine the amount and distribution of metals within Lake Powell.

Mollusk Fossils
USGS Mollusk Fossils in the Denver Collection.
USGS Mollusk Fossils in the Denver Collection.

A broken slab is all that's left of Fish Inn after Hurricane Michael
A broken slab is all that's left of Fish Inn after Hurricane MichaelA broken concrete foundation and some shattered floor tiles were all that remained of the sea turtle researchers' field station and home base after Category Four Hurricane Michael struck Cape San Blas on Oct. 10, 2018.
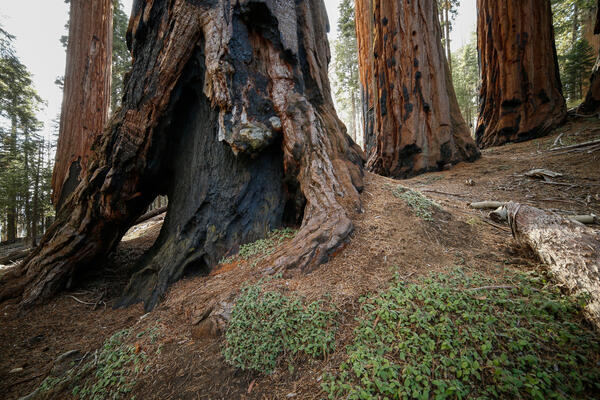
Burned, hollowed out base of a sequoia tree in Sequoia National Park
Burned, hollowed out base of a sequoia tree in Sequoia National ParkBurned, hollowed out base of a sequoia tree in Sequoia National Park
Burned, hollowed out base of a sequoia tree in Sequoia National Park
Burned, hollowed out base of a sequoia tree in Sequoia National ParkBurned, hollowed out base of a sequoia tree in Sequoia National Park

Coral cores like this one reveal geologic history of Keys reefs
Coral cores like this one reveal geologic history of Keys reefsUSGS Research Oceanographer Lauren Toth and Oceanographer Anastasios Stathakopoulos study a coral-reef core in the USGS’s Core Archive in St. Petersburg, Florida. Photo: Dominique Gallery, USGS.