
A deeply eroded sand dune on the beach at Cape San Blas shows Hurricane Michael's impact on parts of the Florida Panhandle shoreline.
Images
Images
Filter Total Items: 9454

Hurricane Michael cut deep into Panhandle dunes
A deeply eroded sand dune on the beach at Cape San Blas shows Hurricane Michael's impact on parts of the Florida Panhandle shoreline.

Hurricane Michael destroyed many houses on Cape San Blas, Florida
Hurricane Michael destroyed many houses on Cape San Blas, FloridaA beach house in Cape San Blas, Florida destroyed by Hurricane Michael, which struck the Florida Panhandle as a Category Four storm Oct. 10, 2018.
Hurricane Michael destroyed many houses on Cape San Blas, Florida
Hurricane Michael destroyed many houses on Cape San Blas, FloridaA beach house in Cape San Blas, Florida destroyed by Hurricane Michael, which struck the Florida Panhandle as a Category Four storm Oct. 10, 2018.

New Gulf of Mexico network speeds USGS hurricane preparations
New Gulf of Mexico network speeds USGS hurricane preparationsEach one these blue dots represents a site where a storm-tide sensor bracket has been installed for the Gulf of Mexico pre-defined network. There are currently 85 brackets in Florida, 6 in Alabama, 3 in Mississippi, 18 in Louisiana and 26 in Texas, for a total of 138 bracketed sites. (Not all brackets will be used in all storms.)

Sunrise at Mount St. Helens
The sun rises at Mount St. Helens (pictured in the distance), with low-level clouds covering Coldwater Lake. The view is from the Coldwater Science and Learning Center, the site of the 2018 GeoGirls field camp program.
The sun rises at Mount St. Helens (pictured in the distance), with low-level clouds covering Coldwater Lake. The view is from the Coldwater Science and Learning Center, the site of the 2018 GeoGirls field camp program.

This Flood Event Viewer is a one-stop information source
This Flood Event Viewer is a one-stop information sourceThe USGS creates a Flood Event Viewer for major flooding incidents, as a one-stop, interactive information source. On that website, viewers can click on each red dot (storm-tide sensor) to see details about it.

Fish Inn, the scientists' field station, before Hurricane Michael
Fish Inn, the scientists' field station, before Hurricane MichaelFor ten years, this yellow concrete block house in Cape San Blas, Florida, dubbed Fish Inn, was the seasonal office, laboratory and living quarters for a team of USGS sea turtle researchers during their field season from November till April.

Strong hurricane impacts predicted for many Panhandle beaches
Strong hurricane impacts predicted for many Panhandle beachesCoastal Change Storm Hazard Team map created Tuesday, 10/89/18 showing current forecasted beach erosion, overwash and inundation effects of Hurricane Michael's predicted landfall in the Florida Panhandle. Forecast will change with subsequent National Hurricane Center forecasts.
A USGS hydrographer multi-tasking as he installs storm-tide sensors
A USGS hydrographer multi-tasking as he installs storm-tide sensorsBrett Johnston, USGS hydrographer, enters storm-tide sensor information into a USGS data management system on October 8 near Fish Creek, Florida. USGS Photo by Brett Johnston.

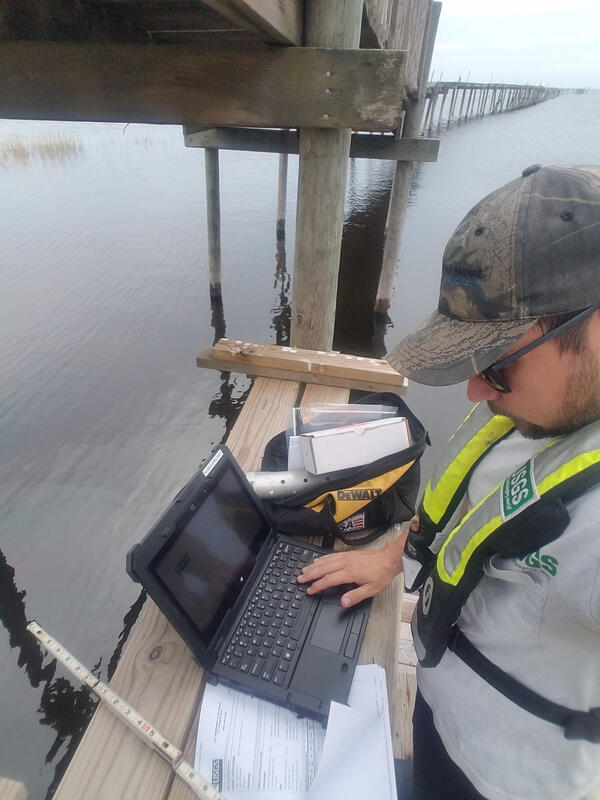
Collecting flood data on the Llano River in response to a flash flood
Collecting flood data on the Llano River in response to a flash floodUSGS scientist Scott Grzyb reviews high-water data collected by boat on the Llano River in Llano, Texas in response to a flash flood on October 8, 2018.
Collecting flood data on the Llano River in response to a flash flood
Collecting flood data on the Llano River in response to a flash floodUSGS scientist Scott Grzyb reviews high-water data collected by boat on the Llano River in Llano, Texas in response to a flash flood on October 8, 2018.

End of a long day collecting flood data on the Llano River
End of a long day collecting flood data on the Llano RiverUSGS scientists Scrott Grzyb and Michael Scheider pause at sunset at the end of a long day collecting high-water measurements along the Llano River on October 8, 2018.
End of a long day collecting flood data on the Llano River
End of a long day collecting flood data on the Llano RiverUSGS scientists Scrott Grzyb and Michael Scheider pause at sunset at the end of a long day collecting high-water measurements along the Llano River on October 8, 2018.

USGS science on a map of the Carolinas after Hurricane Florence
USGS science on a map of the Carolinas after Hurricane FlorenceThis flood event viewer map, dated Oct. 3, 2018, shows the extent and type of information collected by USGS hydrologists in North and South Carolina in the wake of historic flooding brought on by Hurricane Florence.

Flooding at Vekol Wash, Arizona
Flooding at Vekol Wash today, south of Phoenix, following remnant rains from Hurricane Rosa.
Flooding at Vekol Wash today, south of Phoenix, following remnant rains from Hurricane Rosa.

Double-checking a high water mark on a church door near Maxton, NC
Double-checking a high water mark on a church door near Maxton, NCUSGS hydrographer Daniel McCay uses a level to double-check a high water mark on a church door near Maxton, NC as his USGS colleague Mary Winsor observes on Sept. 25, 2018, in the wake of flooding brought on by Hurricane Florence.

A high water mark above the eaves of a Spring Hill, NC house
A high water mark above the eaves of a Spring Hill, NC houseUSGS hydrologic technician Rob Forde flags a high water mark above the eaves at Presbyterian Church of the Covenant, 118 Manchester Road, Spring Hill, North Carolina on Sept. 21, 2018, in the wake of flooding brought on by Hurricane Florence.

Measuring a high water mark as flooding recedes
USGS hydrographer Kyle Marchman measures a high water mark on the rear wall of a Kangaroo gas station on Highway 24 north of Fayetteville, NC on Sept. 18, 2018, after flooding caused by Hurricane Florence.
USGS hydrographer Kyle Marchman measures a high water mark on the rear wall of a Kangaroo gas station on Highway 24 north of Fayetteville, NC on Sept. 18, 2018, after flooding caused by Hurricane Florence.

Measuring the Lumber River floodwaters
James Stonecypher measures flood waters from the Lumber River that breached a dam in Lumberton, North Carolina after the passage of Hurricane Florence, Sept. 17, 2018.
James Stonecypher measures flood waters from the Lumber River that breached a dam in Lumberton, North Carolina after the passage of Hurricane Florence, Sept. 17, 2018.

Working to keep vital flood information flowing in the Carolinas
Working to keep vital flood information flowing in the CarolinasDavid Stillwell, USGS hydrologic technician, performs a discharge measurement to help document and forecast flooding caused by Hurricane Florence at Long Creek in Rhyne, North Carolina on Sept. 16.
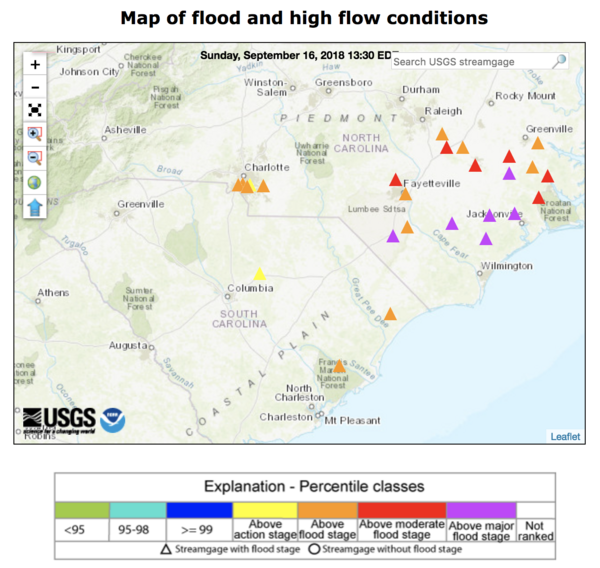
As Florence rains, rivers keep rising, submerging some USGS instrument
As Florence rains, rivers keep rising, submerging some USGS instrumentA WaterWatch web map shows streamgages in North and South Carolina that approached or exceeded major flood stage EST on September 19, 2018, as the former Hurricane Florence, now downgraded to a tropical depression, deluged the states with rain.

Strom sensor deployed in Pennsylvania for Hurricane Florence
Strom sensor deployed in Pennsylvania for Hurricane FlorenceThis photo shows one of 8 storm sensors deployed in Pennsylvania to monitor the potential effects Hurricane Florence could have on already high rivers across the state. Photo by Matthew Gyves, USGS.

Hurricane Florence will erode or overwash beaches
The USGS Coastal Change Hazards Storm Team has forecast coast-wide levels of beach erosion, inundation and overwash due to Hurricane Florence's expected path and landgfall.
The USGS Coastal Change Hazards Storm Team has forecast coast-wide levels of beach erosion, inundation and overwash due to Hurricane Florence's expected path and landgfall.

Sea water levels to go up, stay up as Florence affects coast
Sea water levels to go up, stay up as Florence affects coastThe Coastal Change Hazards Storm Team has forecast changing water levels at specific locations over time.
Sea water levels to go up, stay up as Florence affects coast
Sea water levels to go up, stay up as Florence affects coastThe Coastal Change Hazards Storm Team has forecast changing water levels at specific locations over time.