
Streamgaging on Martin Creek, near Paradise Valley, Nevada.
Images
Images
Filter Total Items: 9449

Streamgaging on Martin Creek in Nevada
Streamgaging on Martin Creek, near Paradise Valley, Nevada.

Exposed bedrock at low tide
Exposed bedrock on the beach, below the University of California, Santa Barbara.
Exposed bedrock on the beach, below the University of California, Santa Barbara.

Armoring the shore at Goleta Beach
Installing large boulders as rip rap to armor the shore against further erosion at Goleta Beach in Southern California. The tide is very low (negative).
Installing large boulders as rip rap to armor the shore against further erosion at Goleta Beach in Southern California. The tide is very low (negative).

Exposed bedrock at Isla Vista
Exposed bedrock on the beach during very low (negative) tide at Isla Vista, California
Exposed bedrock on the beach during very low (negative) tide at Isla Vista, California

Exposed bedrock at Isla Vista beach
Bedrock exposed at low tide along the beach at Isla Vista, California
Bedrock exposed at low tide along the beach at Isla Vista, California

Beach loss and armoring at Goleta Beach
Beach loss and armoring at Goleta Beach, very low (negative) tide
Beach loss and armoring at Goleta Beach, very low (negative) tide

A snowflake chain? Nope. A one-celled green alga.
The desmid family of single-celled green algae are never found in abundance, says USGS biologist Barry Rosen. They inhabit the soft, slightly acidic water of wetlands that depend on rainwater, like Florida’s Arthur R. Marshall Loxahatchee National Wildlife Refuge. They don’t “bloom” en masse, but their presence is an indicator of good water quality.
The desmid family of single-celled green algae are never found in abundance, says USGS biologist Barry Rosen. They inhabit the soft, slightly acidic water of wetlands that depend on rainwater, like Florida’s Arthur R. Marshall Loxahatchee National Wildlife Refuge. They don’t “bloom” en masse, but their presence is an indicator of good water quality.

Satellite Image of the Delaware Bay and Chesapeake Bay Region
Satellite Image of the Delaware Bay and Chesapeake Bay RegionThis Indian Space Research Organization LISS-3 image of the Delaware Bay and Chesapeake Bay region, acquired on January 25, 2017, shows the landscape along the densely populated U.S. East coast. Ecosystems and sea-level rise are among the regional landscape changes that satellite imagery helps to monitor.

Snowpack Study
Student Aurelia Mitchell recently trekked up into the Sandia Mountains to collect snow data as part of an ongoing hydrologic study in the East Mountains, conducted in cooperation with the Bernalillo County Public Works Division. They measured the depth and density of the snow in several locations to determine the snow/water equivalent.
Student Aurelia Mitchell recently trekked up into the Sandia Mountains to collect snow data as part of an ongoing hydrologic study in the East Mountains, conducted in cooperation with the Bernalillo County Public Works Division. They measured the depth and density of the snow in several locations to determine the snow/water equivalent.

Shoreline changes at Bogoslof volcano
Analysis of shoreline changes at Bogoslof volcano due to eruptive activity between January 11 and 24, 2017. The base image is a Worldview-2 satellite image collected on January 24, 2017. The approximate location of the shoreline on January 11, 2017 is shown by the dashed orange line.
Analysis of shoreline changes at Bogoslof volcano due to eruptive activity between January 11 and 24, 2017. The base image is a Worldview-2 satellite image collected on January 24, 2017. The approximate location of the shoreline on January 11, 2017 is shown by the dashed orange line.

Snowpack Study
Hydrologist Ryan McCutcheon and student Aurelia Mitchell recently trekked up into the Sandia Mountains in Albuquerque, New Mexico to collect snow data as part of an ongoing hydrologic study in the East Mountains, conducted in cooperation with the Bernalillo County Public Works Division.
Hydrologist Ryan McCutcheon and student Aurelia Mitchell recently trekked up into the Sandia Mountains in Albuquerque, New Mexico to collect snow data as part of an ongoing hydrologic study in the East Mountains, conducted in cooperation with the Bernalillo County Public Works Division.

Spattering along a down-welling section of Kīlauea Volcano's summit
Spattering along a down-welling section of Kīlauea Volcano's summitThis telephoto image from January 19, 2017, shows spattering along a down-welling section of Kīlauea Volcano's summit lava lake. The main area of spattering was about 10 m (32 ft) high, but some lava fragments were thrown even higher.

Annotated photo of Bogoslof Island showing effects of eruption
Annotated photo of Bogoslof Island showing effects of eruptionAnnotated photograph of Bogoslof Island showing the cumulative effects of 2016-17 eruptive activity. A layer of fine muddy appearing ash drapes most of the landscape and covers pre-existing vegetation. The dashed line indicates the area excavated by explosive eruptive activity so far.

Acoustic Doppler Current Profiler
A U.S. Geological Survey field crew uses an Acoustic Doppler Current Profiler to measure water velocity on the Truckee River in Reno, Nevada.
A U.S. Geological Survey field crew uses an Acoustic Doppler Current Profiler to measure water velocity on the Truckee River in Reno, Nevada.

USGS Leetown Science Center Administration Building
USGS Leetown Science Center Administration BuildingMorning snowfall at the Leetown Science Center's Administration building.
USGS Leetown Science Center Administration Building
USGS Leetown Science Center Administration BuildingMorning snowfall at the Leetown Science Center's Administration building.

Sonar-equipped personal watercraft mapping bathymetry.
Sonar-equipped personal watercraft mapping bathymetry.A sonar-equipped personal watercraft mapping the bathymetry underwater near Santa Cruz, Calif.
Sonar-equipped personal watercraft mapping bathymetry.
Sonar-equipped personal watercraft mapping bathymetry.A sonar-equipped personal watercraft mapping the bathymetry underwater near Santa Cruz, Calif.

Readying a sonar-equipped boat for mapping
USGS scientists readying a sonar-equipped boat to map the ocean bottom near Santa Cruz, Calif.
USGS scientists readying a sonar-equipped boat to map the ocean bottom near Santa Cruz, Calif.

Mapping the beach with a GPS-equipped backpack unit.
Mapping the beach with a GPS-equipped backpack unit.USGS scientist Daniel Hoover mapping the beach at Santa Cruz with a GPS-equipped backpack unit.
Mapping the beach with a GPS-equipped backpack unit.
Mapping the beach with a GPS-equipped backpack unit.USGS scientist Daniel Hoover mapping the beach at Santa Cruz with a GPS-equipped backpack unit.

Setting up a lidar scanner to map the beach.
USGS scientists setting up a lidar scanner on the pier to map the beach near Capitola, California.
USGS scientists setting up a lidar scanner on the pier to map the beach near Capitola, California.
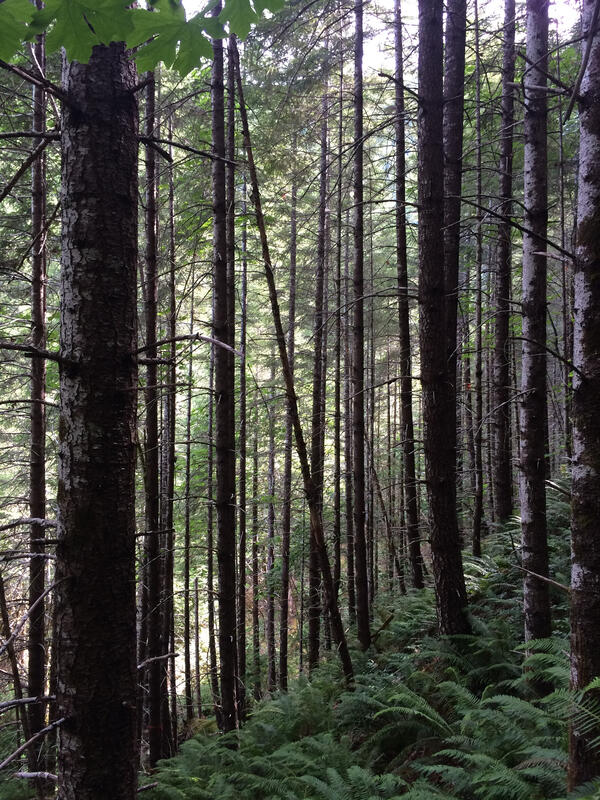
Closed Canopy Plantation
Example of a closed canopy plantation logged 60 years ago at the HJ Andrews Experimental Forest in Oregon, old growth forests have bigger trees and a more complex understory.
Example of a closed canopy plantation logged 60 years ago at the HJ Andrews Experimental Forest in Oregon, old growth forests have bigger trees and a more complex understory.

Chinese Firebelly Newt
A Chinese firebelly newt (Cynops orientalis), the first salamander species found to be infected with the spring viraemia of carp virus.
A Chinese firebelly newt (Cynops orientalis), the first salamander species found to be infected with the spring viraemia of carp virus.