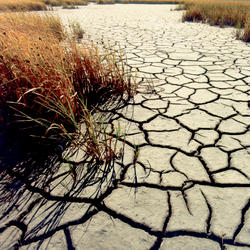
2020 drought impact on Segreganset River near Dighton, Massachusetts
2020 drought impact on Segreganset River near Dighton, Massachusetts2020 drought impact on Segreganset River near USGS station 01109070, Dighton, Massachusetts

Official websites use .gov
A .gov website belongs to an official government organization in the United States.
Secure .gov websites use HTTPS
A lock () or https:// means you’ve safely connected to the .gov website. Share sensitive information only on official, secure websites.
Any large-scale projects for mitigating drought in the U.S. would fall under the direction of the Bureau of Reclamation, which is the federal agency tasked with water management.
While technically feasible, transporting surface water from flood areas (or the ocean) to drought areas faces many challenges including water rights, property rights, environmental impacts, and more. Then there's the considerable expense of building pipelines and pumping the water. Pumping large amounts of water from one place to another--especially if it must be pumped uphill--can require enormous amounts of energy. Pumping seawater (which is corrosive) adds a new set of complications.
Cost estimates for projects like this vary, but the cost of re-routing new sources of water is often too expensive, which is why cities in the Western U.S. are emphasizing water conservation.
Desalination of seawater and desalination of brackish groundwater are other expensive options. Some cities, like San Diego, have already built desalination plants, but desalination comes with its own set of issues, including the large amount of power required and some serious environmental consequences.
Learn more: 2012 Bureau of Reclamation Colorado River Basin Water Supply and Demand Study

Earth is estimated to hold about 1,386,000,000 cubic kilometers of water. The breakdown of where all that water resides is estimated as follows: Oceans (saline) 1,338,000,000 cubic kilometers Ice caps and glaciers (fresh) 24,064,000 cubic kilometers Groundwater (fresh and saline) 23,400,000 cubic kilometers Streams, lakes, swamps (fresh) 104,590 cubic kilometers Lakes (saline) 85,400 cubic...

Since 1950, the USGS has collected and analyzed water-use data for the United States and its Territories. That data is revised every 5 years. As of 2015, the United States uses 322 billion gallons of water per day (Bgal/day). The three largest water-use categories were irrigation (118 Bgal/day), thermoelectric power (133 Bgal/day), and public supply (39 Bgal/day), cumulatively accounting for 90...
A drought is a period of drier-than-normal conditions that results in water-related problems. The amount of precipitation at a particular location varies from year to year, but over a period of years the average amount is fairly constant. In the deserts of the Southwest, the average precipitation is less than 3 inches per year. In contrast, the average precipitation in the Northwest is more than...

The beginning of a drought is difficult to determine. Several weeks, months, or even years might pass before people know that a drought is occurring. The end of a drought can occur as gradually as it began. The first evidence of drought is usually seen in records of rainfall. Within a short period of time, the amount of moisture in soils can begin to decrease. The effects of a drought on flow in...

To view the USGS streamflow information on drought, see the drought map on our WaterWatch site, which shows below-normal, 7-day average streamflow compared to historical streamflow for the United States. Links to additional maps and drought data are listed on the USGS Drought website and the National Integrated Drought Information System (NIDIS).

Rainfall in any form will provide some drought relief. A good analogy might be how medicine and illness relate to each other. A single dose of medicine can alleviate symptoms of illness, but it usually takes a sustained program of medication to cure an illness. Likewise, a single rainstorm will not break the drought, but it might provide temporary relief. A light to moderate shower will probably...

In the U.S., about 13 percent of all water used is saline water. But saline water can only be used for certain purposes. The main use is for thermoelectric power-plant cooling. About 5 percent of water used for industrial purposes is saline, and about 53 percent of all water used for mining purposes is saline. Saline water can be desalinated for use as drinking water by putting it through a...

Flood predictions require several types of data: The amount of rainfall occurring on a real-time basis. The rate of change in river stage on a real-time basis, which can help indicate the severity and immediacy of the threat. Knowledge about the type of storm producing the moisture, such as duration, intensity and areal extent, which can be valuable for determining possible severity of the...

FEMA is the official public source for flood maps for insurance purposes: FEMA’s Flood Map Service Center FEMA’s National Flood Hazard Layer NOAA is responsible for producing flood forecast maps that combine precipitation data with USGS streamflow data: NWS - National Water Prediction Service: River forecasts and long range flood outlook Coastal Inundation Dashboard: Real-time and historical...

River forecasts (flood forecasts) are made by the National Weather Service - National Water Prediction Service. The overall map on the website uses color designations to give a quick overview of current conditions. A legend and other information can be selected in the right column. From the main map, click on a station to bring up a box which includes a graph showing current information and a...

2020 drought impact on Segreganset River near USGS station 01109070, Dighton, Massachusetts
2020 drought impact on Segreganset River near USGS station 01109070, Dighton, Massachusetts

The California Aqueduct flowing near Huron, CA in the San Joaquin Valley. This spot is near one of several USGS land subsidence monitoring stations in the San Joaquin Valley.
The California Aqueduct flowing near Huron, CA in the San Joaquin Valley. This spot is near one of several USGS land subsidence monitoring stations in the San Joaquin Valley.

A hydrologic technician from the USGS Idaho Water Science Center measures streamflow in Lightning Creek at Clark Fork, ID. The USGS is collecting data at hundreds of sites on rivers and streams in six western states to document the 2015 drought. USGS scientists will analyze the data to identify which rivers and streams may be most vulnerable to future droughts.
A hydrologic technician from the USGS Idaho Water Science Center measures streamflow in Lightning Creek at Clark Fork, ID. The USGS is collecting data at hundreds of sites on rivers and streams in six western states to document the 2015 drought. USGS scientists will analyze the data to identify which rivers and streams may be most vulnerable to future droughts.

Stillwater Creek in drought conditions

Aqueducts move water - today and in ancient times
Aqueducts move water - today and in ancient times

Earth is estimated to hold about 1,386,000,000 cubic kilometers of water. The breakdown of where all that water resides is estimated as follows: Oceans (saline) 1,338,000,000 cubic kilometers Ice caps and glaciers (fresh) 24,064,000 cubic kilometers Groundwater (fresh and saline) 23,400,000 cubic kilometers Streams, lakes, swamps (fresh) 104,590 cubic kilometers Lakes (saline) 85,400 cubic...
Since 1950, the USGS has collected and analyzed water-use data for the United States and its Territories. That data is revised every 5 years. As of 2015, the United States uses 322 billion gallons of water per day (Bgal/day). The three largest water-use categories were irrigation (118 Bgal/day), thermoelectric power (133 Bgal/day), and public supply (39 Bgal/day), cumulatively accounting for 90...
A drought is a period of drier-than-normal conditions that results in water-related problems. The amount of precipitation at a particular location varies from year to year, but over a period of years the average amount is fairly constant. In the deserts of the Southwest, the average precipitation is less than 3 inches per year. In contrast, the average precipitation in the Northwest is more than...
The beginning of a drought is difficult to determine. Several weeks, months, or even years might pass before people know that a drought is occurring. The end of a drought can occur as gradually as it began. The first evidence of drought is usually seen in records of rainfall. Within a short period of time, the amount of moisture in soils can begin to decrease. The effects of a drought on flow in...
To view the USGS streamflow information on drought, see the drought map on our WaterWatch site, which shows below-normal, 7-day average streamflow compared to historical streamflow for the United States. Links to additional maps and drought data are listed on the USGS Drought website and the National Integrated Drought Information System (NIDIS).
Rainfall in any form will provide some drought relief. A good analogy might be how medicine and illness relate to each other. A single dose of medicine can alleviate symptoms of illness, but it usually takes a sustained program of medication to cure an illness. Likewise, a single rainstorm will not break the drought, but it might provide temporary relief. A light to moderate shower will probably...
In the U.S., about 13 percent of all water used is saline water. But saline water can only be used for certain purposes. The main use is for thermoelectric power-plant cooling. About 5 percent of water used for industrial purposes is saline, and about 53 percent of all water used for mining purposes is saline. Saline water can be desalinated for use as drinking water by putting it through a...
Flood predictions require several types of data: The amount of rainfall occurring on a real-time basis. The rate of change in river stage on a real-time basis, which can help indicate the severity and immediacy of the threat. Knowledge about the type of storm producing the moisture, such as duration, intensity and areal extent, which can be valuable for determining possible severity of the...
FEMA is the official public source for flood maps for insurance purposes: FEMA’s Flood Map Service Center FEMA’s National Flood Hazard Layer NOAA is responsible for producing flood forecast maps that combine precipitation data with USGS streamflow data: NWS - National Water Prediction Service: River forecasts and long range flood outlook Coastal Inundation Dashboard: Real-time and historical...
River forecasts (flood forecasts) are made by the National Weather Service - National Water Prediction Service. The overall map on the website uses color designations to give a quick overview of current conditions. A legend and other information can be selected in the right column. From the main map, click on a station to bring up a box which includes a graph showing current information and a...
2020 drought impact on Segreganset River near USGS station 01109070, Dighton, Massachusetts
2020 drought impact on Segreganset River near USGS station 01109070, Dighton, Massachusetts
The California Aqueduct flowing near Huron, CA in the San Joaquin Valley. This spot is near one of several USGS land subsidence monitoring stations in the San Joaquin Valley.
The California Aqueduct flowing near Huron, CA in the San Joaquin Valley. This spot is near one of several USGS land subsidence monitoring stations in the San Joaquin Valley.
A hydrologic technician from the USGS Idaho Water Science Center measures streamflow in Lightning Creek at Clark Fork, ID. The USGS is collecting data at hundreds of sites on rivers and streams in six western states to document the 2015 drought. USGS scientists will analyze the data to identify which rivers and streams may be most vulnerable to future droughts.
A hydrologic technician from the USGS Idaho Water Science Center measures streamflow in Lightning Creek at Clark Fork, ID. The USGS is collecting data at hundreds of sites on rivers and streams in six western states to document the 2015 drought. USGS scientists will analyze the data to identify which rivers and streams may be most vulnerable to future droughts.
Stillwater Creek in drought conditions
Aqueducts move water - today and in ancient times
Aqueducts move water - today and in ancient times