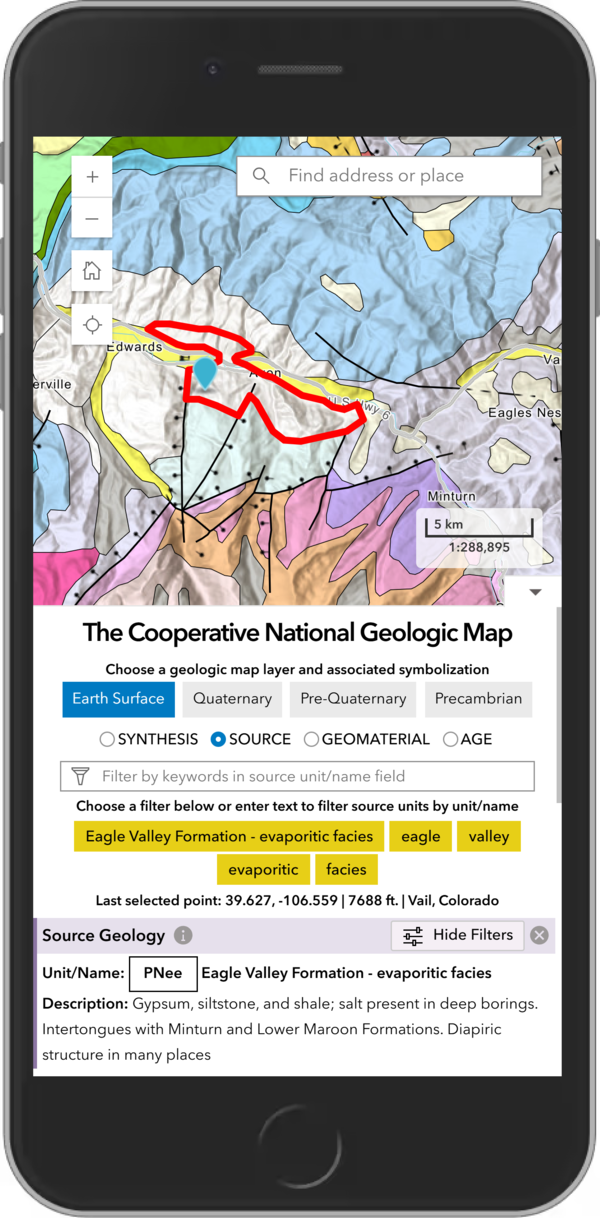
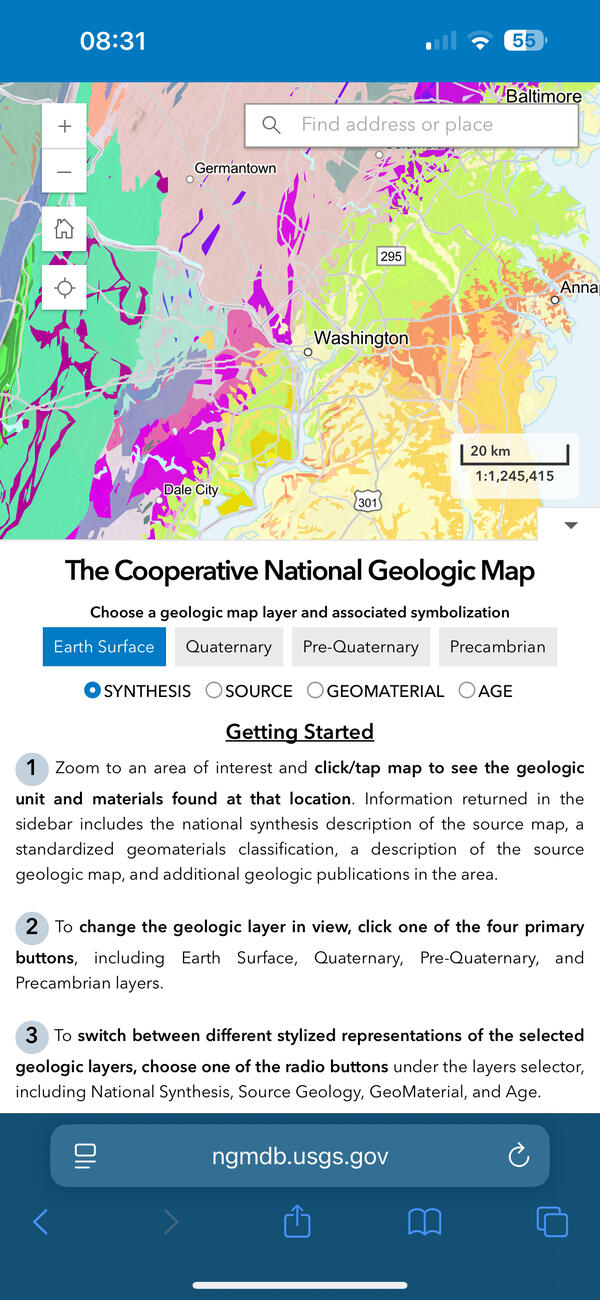
U.S. flag

An official website of the United States government

Multimedia

Listed below are multimedia items directly associated with the Geology, Energy & Minerals Science Center:

Images

Depiction of the Geoheritage Sites of the Nation Explorer showing the continental United States with green location markers of geoheritage sites.
Geoheritage Explorer.jpg

This is an image of the Geoheritage Sites of the Nation Explorer, which is an interactive web map application featuring the 55 geoheritage sites from the Geoheritage Sites of the Nation Data Release v.1. 

This is an image of the Geoheritage Sites of the Nation Explorer, which is an interactive web map application featuring the 55 geoheritage sites from the Geoheritage Sites of the Nation Data Release v.1. 

Group photo on overlook with great falls in the background
Group photo of attendees to the field trip that was part of the NER SLaM fall meeting

Group photo of attendees to the field trip that was part of the NER SLaM fall meeting.

Great Falls, Maryland

Fall 2024 Photo Contest Winner: Carla Brezinski, Honorable Mention

Group photo of attendees to the field trip that was part of the NER SLaM fall meeting.

Great Falls, Maryland

Fall 2024 Photo Contest Winner: Carla Brezinski, Honorable Mention

PFOS and sulfate reducing bacteria
PFOS in the presence of sulfate-reducing bacteria

PFOS removal occurred as sulfate-reducing bacteria increased in soil experiments with a dehalogenating culture. Graphic Credits: Denise Akob

PFOS removal occurred as sulfate-reducing bacteria increased in soil experiments with a dehalogenating culture. Graphic Credits: Denise Akob

Schematic cross section showing examples of chemical, mechanical, and thermal geologic energy storage methods
Geologic Energy Storage

Schematic cross section showing examples of chemical, mechanical, and thermal geologic energy storage methods in potential underground settings in a sedimentary basin. This illustration is a higher resolution version of figure 2 of USGS Fact Sheet 2022-3084.

Schematic cross section showing examples of chemical, mechanical, and thermal geologic energy storage methods in potential underground settings in a sedimentary basin. This illustration is a higher resolution version of figure 2 of USGS Fact Sheet 2022-3084.

Graph of energy storage capacity in relation to discharge
Typical energy storage capacity compared to typical discharge duration for various geologic and nongeologic energy storage methods

Figure 3 from USGS Fact Sheet 2022-3082. Graph of typical energy storage capacity compared to typical discharge duration for various geologic and nongeologic energy storage methods. Oval sizes are estimated based on current technology. Modified from Crotogino and others (2017) and Matos and others (2019).

Figure 3 from USGS Fact Sheet 2022-3082. Graph of typical energy storage capacity compared to typical discharge duration for various geologic and nongeologic energy storage methods. Oval sizes are estimated based on current technology. Modified from Crotogino and others (2017) and Matos and others (2019).

Was this page helpful?