
Drillers from the USGS Research Drilling Program using a drill rig to install a 42 foot length of schedule 80 extensometer pipe at the James River extensometer site.
Images
Explore our planet and learn more about our work through photographs and imagery from scientists and support staff.
Filter Total Items: 408
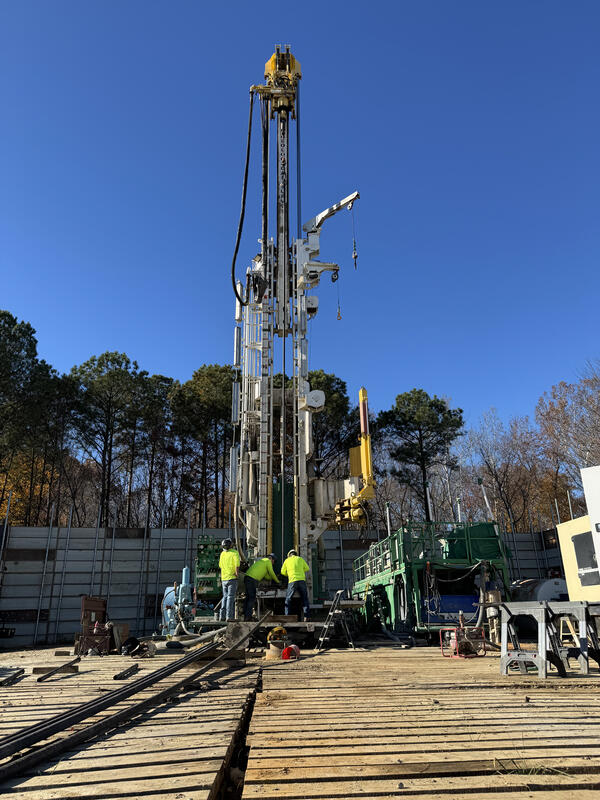
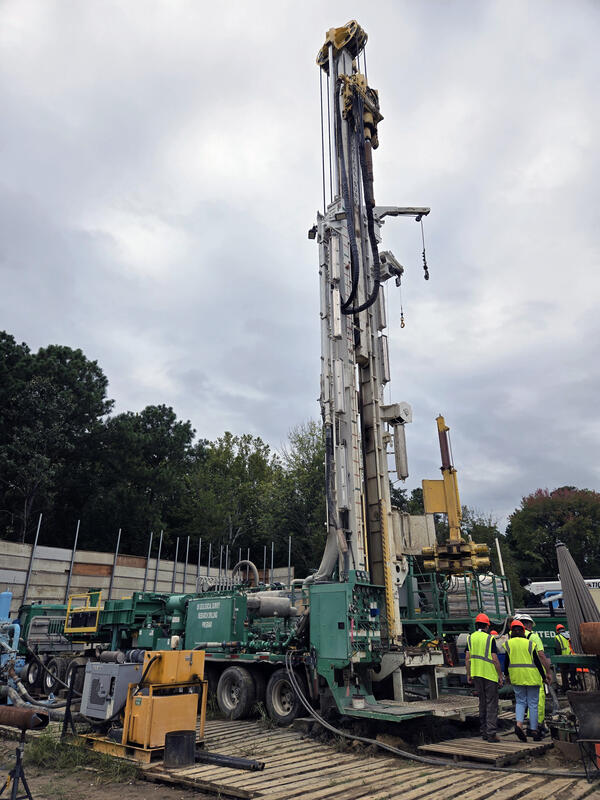
James River Extensometer Installation
Drillers from the USGS Research Drilling Program using a drill rig to install a 42 foot length of schedule 80 extensometer pipe at the James River extensometer site.
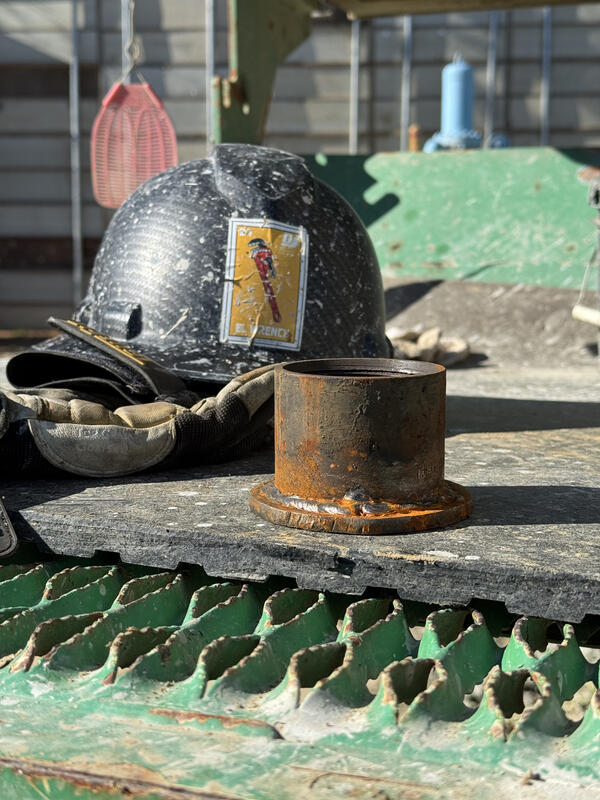
Extensometer Foot
The foot of the James River Extensometer shortly before installation, with a nearby hardhat for scale. The extensometer foot is installed at the very base of the extensometer hole, at a depth of 1280 feet in the case of the James River Extensometer. All 1280 feet of extensometer pipe gently rests on the extensometer foot.
The foot of the James River Extensometer shortly before installation, with a nearby hardhat for scale. The extensometer foot is installed at the very base of the extensometer hole, at a depth of 1280 feet in the case of the James River Extensometer. All 1280 feet of extensometer pipe gently rests on the extensometer foot.
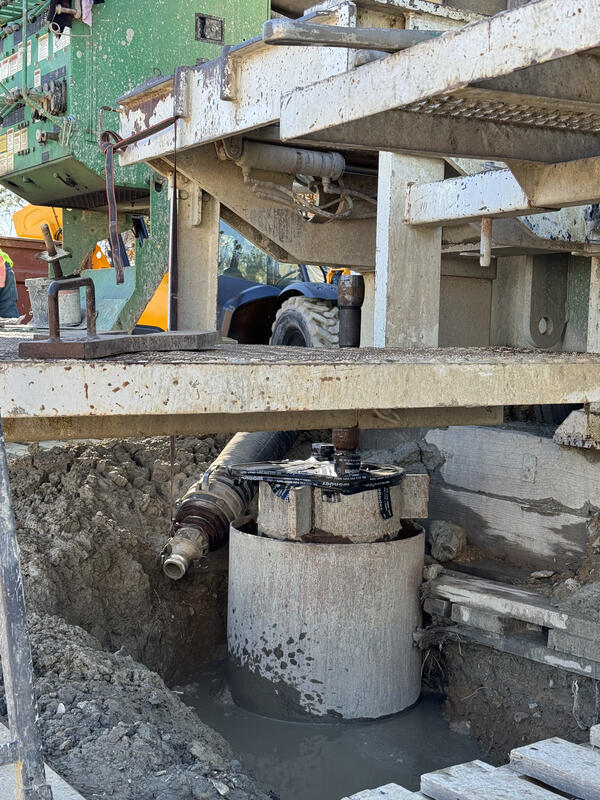
James River Deep Extensometer After Completion of Drilling
James River Deep Extensometer After Completion of DrillingThe completed Jame River extensometer borehole. The nested 24-inch diameter conductor casing, 16-inch diameter surface casing, 7-inch diameter steel casing, and the 2-inch diameter extensometer rod are all visible protruding upwards from the ground.
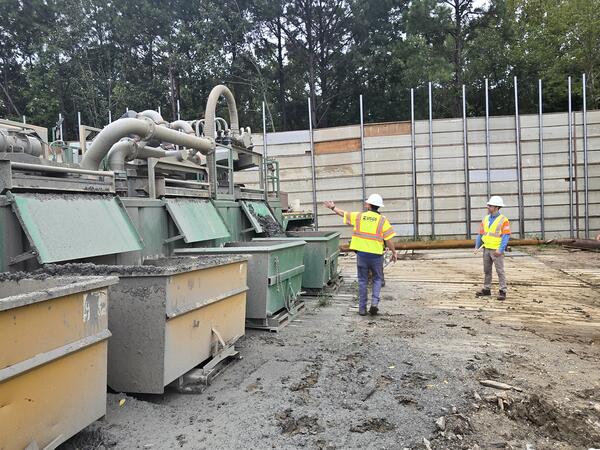
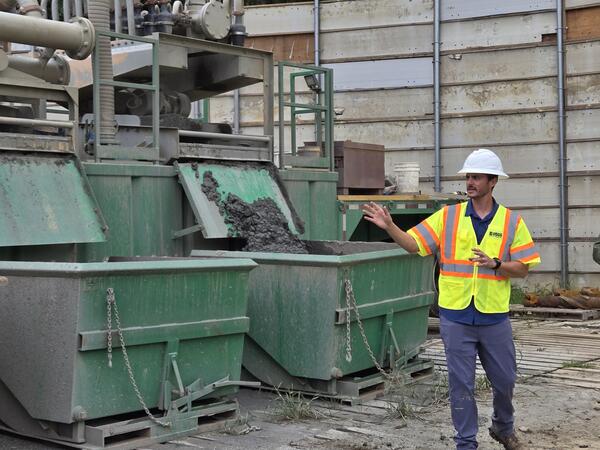
Tour of the James River Extensometer drill site
Greg Connock, a USGS geologist, leads a tour of the James River Extensometer drill site. He indicates where drilled sediments are deposited out of the shaker.
Greg Connock, a USGS geologist, leads a tour of the James River Extensometer drill site. He indicates where drilled sediments are deposited out of the shaker.
Drilling the James River Extensometer
A USGS Research Drilling Program rig at the site of the James River Extensometer.
A USGS Research Drilling Program rig at the site of the James River Extensometer.
Geologist Greg Connock giving a tour of a USGS drill rig
Geologist Greg Connock giving a tour of a USGS drill rigUSGS Geologist Greg Connock gives a tour of a drill rig at the James River Extensometer drill site during a community outreach event.
Geologist Greg Connock giving a tour of a USGS drill rig
Geologist Greg Connock giving a tour of a USGS drill rigUSGS Geologist Greg Connock gives a tour of a drill rig at the James River Extensometer drill site during a community outreach event.
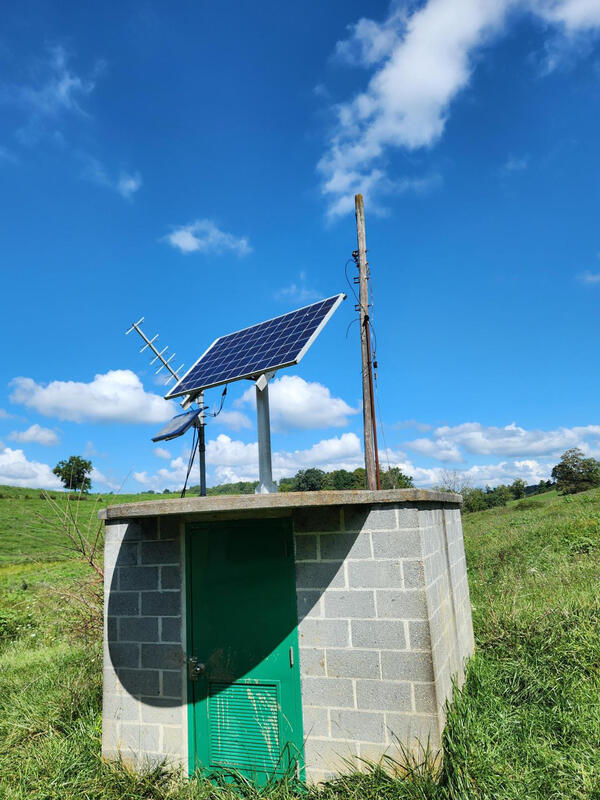
Christiansburg Wellhouse
The wellhouse in Christiansburg, Virginia which houses State Observation Well 019. Data for this site can be found at USGS Water Data for the Nation.
The wellhouse in Christiansburg, Virginia which houses State Observation Well 019. Data for this site can be found at USGS Water Data for the Nation.
Joel Maynard (VA DEQ) at State Observation Well 19 in Christiansburg, Virginia
Joel Maynard (VA DEQ) at State Observation Well 19 in Christiansburg, VirginiaJoel Maynard (Virginia Department of Environmental Quality) at 27F 2 Sow 019. Data for this site can be found at USGS Water Data for the Nation.
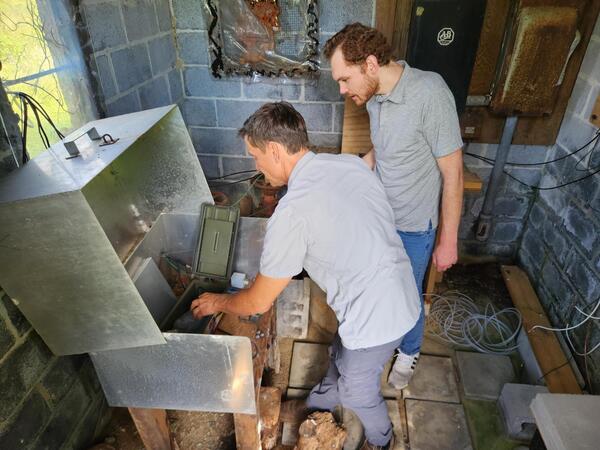
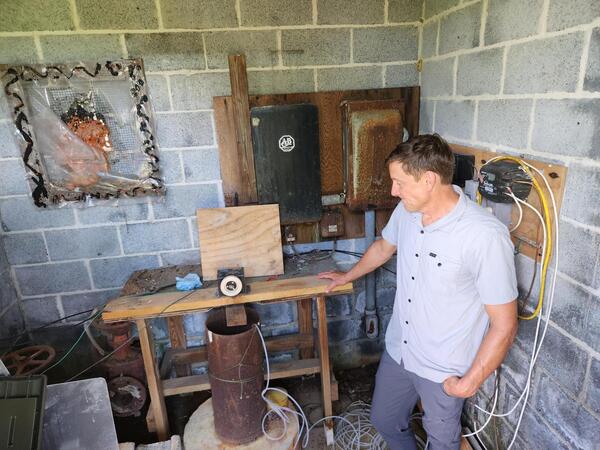
DEQ Scientist and Reporter visit State Observation Well 19 in Christiansburg, Virginia
DEQ Scientist and Reporter visit State Observation Well 19 in Christiansburg, VirginiaJoel Maynard (VA DEQ) demonstrates to Nick Gilmore (WVTF) how data is collected from State Observation Well 019 in Christiansburg, Virginia. Data for this site can be found at USGS Water Data for the Nation.
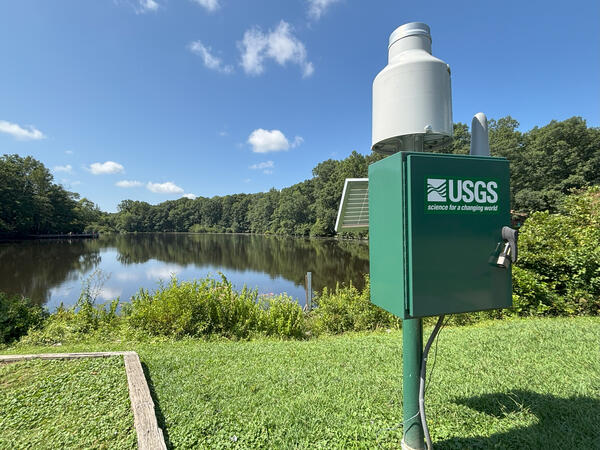
Hydrologic Monitoring Station at Echo Lake Dam near Glen Allen, VA
Hydrologic Monitoring Station at Echo Lake Dam near Glen Allen, VAThe hydrologic monitoring station 0204226958 located at Echo Lake Park in Glen Allen, VA.
This monitoring site collects both precipitation and gage height data, which can be viewed at the Water Data for the Nation website.
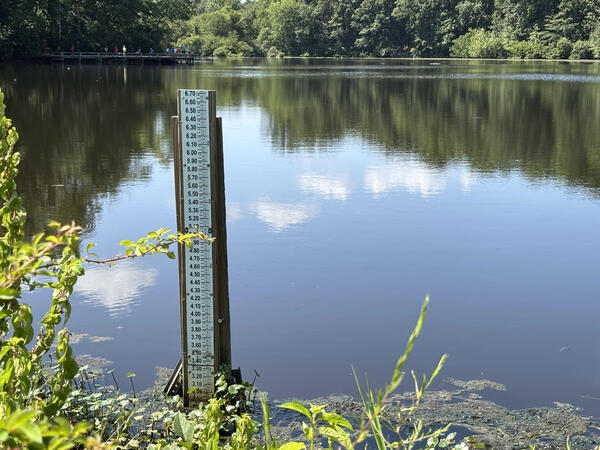
Staff Gage in Waterfront Lake, Innsbrook, VA
A staff gage, used to measure peak streamflow at the hydrologic monitoring station 0204226163 located at the Waterfront Lake Dam in Innesbrook, VA.
A staff gage, used to measure peak streamflow at the hydrologic monitoring station 0204226163 located at the Waterfront Lake Dam in Innesbrook, VA.
Hydrologic Monitoring Station at Echo Lake Dam near Glen Allen, VA
Hydrologic Monitoring Station at Echo Lake Dam near Glen Allen, VAThe hydrologic monitoring station 0204226958 located at Echo Lake Park in Glen Allen, VA.
This monitoring site collects both precipitation and gage height data, which can be viewed at the Water Data for the Nation website.
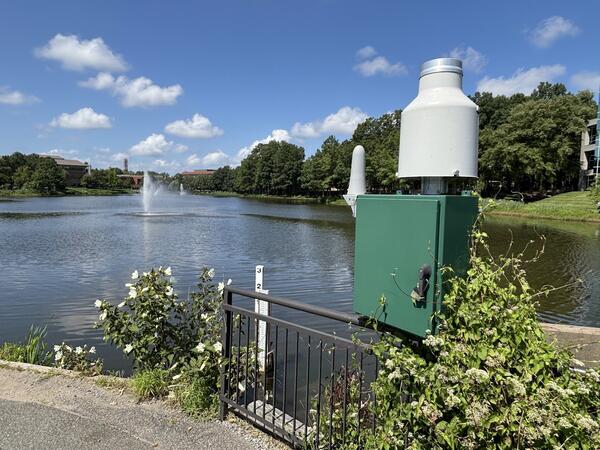
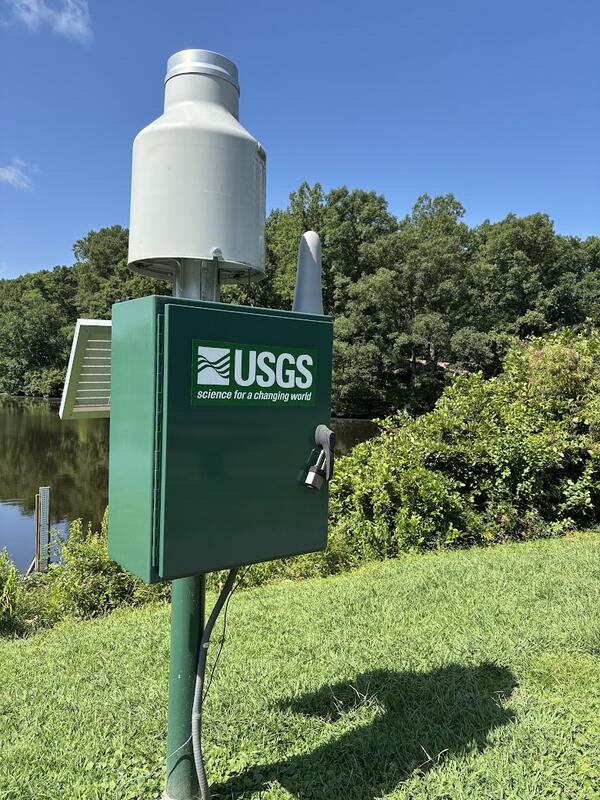
Hydrologic Monitoring Station at Waterfront Lake, Innsbrook, VA
Hydrologic Monitoring Station at Waterfront Lake, Innsbrook, VAThe hydrologic monitoring station 0204226163 located at the Waterfront Lake Dam in Innesbrook, VA.
This monitoring site collects both precipitation and gage height data, which can be viewed at the Water Data for the Nation website.
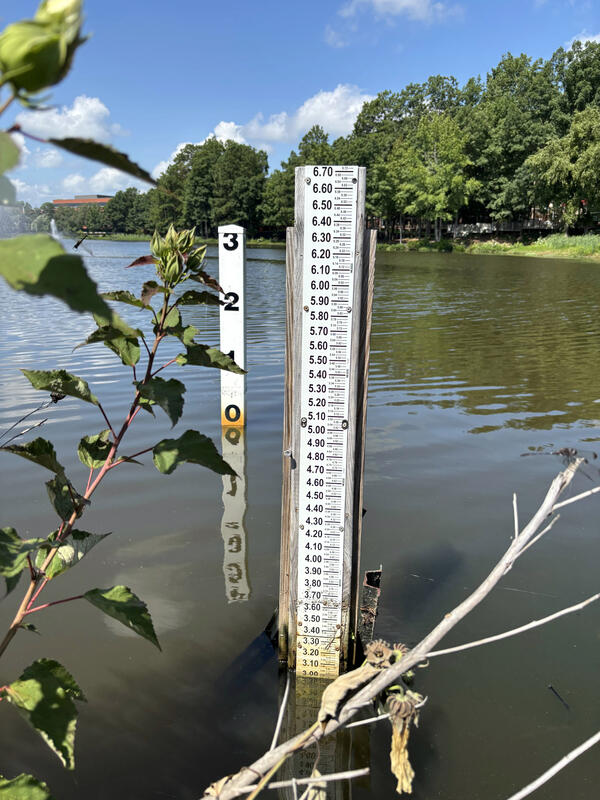
Staff Gage in Echo Lake, Glen Allen, VA
A staff gage, used to measure peak streamflow at the hydrologic monitoring station 0204226958 located at Echo Lake Park in Glen Allen, VA.
This monitoring site collects both precipitation and gage height data, which can be viewed at the Water Data for the Nation website.
A staff gage, used to measure peak streamflow at the hydrologic monitoring station 0204226958 located at Echo Lake Park in Glen Allen, VA.
This monitoring site collects both precipitation and gage height data, which can be viewed at the Water Data for the Nation website.

Geomorphic Transect Measurements Along a Streambank
Geomorphic Transect Measurements Along a StreambankUSGS technician Dan Burns takes measurements along a geomorphic creek transect.
Geomorphic Transect Measurements Along a Streambank
Geomorphic Transect Measurements Along a StreambankUSGS technician Dan Burns takes measurements along a geomorphic creek transect.

Measuring Streambank Erosion and Deposition
USGS technician Dan Burns takes measurements along a geomorphic creek transect.
USGS technician Dan Burns takes measurements along a geomorphic creek transect.

Taking Erosion and Deposition Measurements
USGS technician Dan Burns takes measurements along a geomorphic creek transect.
USGS technician Dan Burns takes measurements along a geomorphic creek transect.

Taking Erosion and Deposition Measurements along a Streambank
Taking Erosion and Deposition Measurements along a StreambankUSGS technician Dan Burns takes measurements along a geomorphic creek transect.
Taking Erosion and Deposition Measurements along a Streambank
Taking Erosion and Deposition Measurements along a StreambankUSGS technician Dan Burns takes measurements along a geomorphic creek transect.

Accotink Creek
Accotink Creek is an urban creek and a tributary of Lake Accotink. Accotink Creek suffers from high rates of streambank erosion, which causes the steep, unstable banks seen on the far side of the creek in the above image.
Accotink Creek is an urban creek and a tributary of Lake Accotink. Accotink Creek suffers from high rates of streambank erosion, which causes the steep, unstable banks seen on the far side of the creek in the above image.

Geomorphic Transect Pin
A geomorphic transect pin shortly after installation on a floodplain.
A geomorphic transect pin shortly after installation on a floodplain.

Measuring a Geomorphic Transect Pin
A USGS technician measures a geomorphic transect pin.
A USGS technician measures a geomorphic transect pin.