
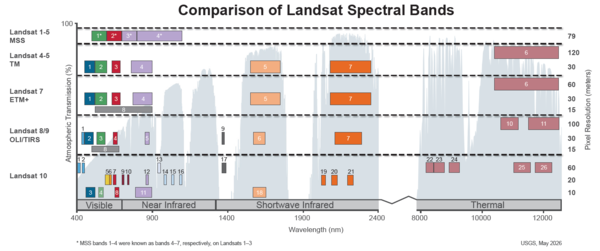
This image shows the spectral bandpasses for the sensors on all Landsat satellites.
Landsat 3
Landsat 3 was operated by NOAA after being launched by NASA. The satellite brought improved technology into space for remote observation researchers.
Media

Sources/Usage: Public Domain. View Media Details
The original Landsat program anticipated two satellites, but with the wide variety of applications for the invaluable data the principal scientists for the program sought to send a third satellite into Earth’s orbit. As early as 1972, six years before launch, NASA Goddard researchers began brainstorming ideas for improving the technology on the Landsat spacecraft.
As a result, Landsat 3 was a modified version of the first two orbiters. Landsat 3’s Return Beam Vidicon (RBV) sensor had an improved spatial resolution of 40 meters, compared to 80 meters for Landsat 1 and 2. In addition, the Landsat 3 Multispectral Scanner System (MSS) sensor was modified to include a thermal infrared band, although the thermal band failed shortly after launch.
The third Landsat spacecraft was launched into space onboard a Delta 2910 rocket from Vandenberg Air Force Base, California on March 5, 1978. The objective of Landsat 3 was to extend the period of space-acquired Earth imagery started by Landsat 1 and Landsat 2. The satellite was placed in standby mode on March 31, 1983 and decommissioned on September 7, 1983.
In 1983, Landsat Operations were moved to NOAA, while USGS EROS continued to maintain the data archive. At the time, NASA was perceived as a research and development agency, and with a functioning earth-observing satellite program, the role of operator needed to be handed off. This was the first step in a long process of commercialization.
Landsat 3 Satellite Orbit Facts
- Orbited the Earth at 917 km (570 mi) in a sun-synchronous, near-polar orbit (99.2 degrees inclination)
- Circled the Earth every 103.34 minutes, completing 14 orbits per day
- Had an 18-day repeat cycle and equatorial crossing time of 9:30 a.m. mean local time (+/- 15 minutes).
- Acquired data on the WRS-1 path/row system, with swath overlap (or sidelap) varying from 14 percent at the Equator to a maximum of approximately 85 percent at 81 degrees north or south latitude.
- With both Landsat 2 and Landsat 3 orbiting, the US could receive nine-day repeat coverage.
Landsat 3 Instruments
Landsat 3 carried the modified versions of the sensors placed on Landsat 1 and Landsat 2: the Return Beam Vidicon (RBV) and the Multispectral Scanner System (MSS).
Media

Sources/Usage: Public Domain. View Media Details
Return Beam Vidicon (RBV)
The RBV sensor utilized vidicon tube instruments containing an electron gun that read images from a photoconductive faceplate similar to television cameras. The data stream received from the satellite was analog-to-digital preprocessed to correct for radiometric and geometric errors.
The RBV system was redesigned for Landsat 3 to use two cameras, mounted side-by-side, with panchromatic spectral response and higher spatial resolution than on Landsat 1 and Landsat 2, to complement the multispectral coverage provided by the MSS. Each of the cameras produced a swath of about 90 km (for a total swath of 180 km).
- 40-meter-ground resolution
- Two cameras operating in one broad spectral band (green to near-infrared; 0.505–0.750 µm)
- Data recorded to 70 millimeter (mm) black and white film rolls
- Data: 3.5 MHz FM video
RBV data was rarely used and considered useful for engineering evaluation purposes rather than science analysis. Visit RBV Film Only for more information.
Multispectral Scanner (MSS)
The MSS sensor was a line-scanning device observing the Earth perpendicular to the orbital track. The cross-track scanning was accomplished by an oscillating mirror; six lines were scanned simultaneously in each of the four spectral bands for each mirror sweep. The forward motion of the satellite provided the along-track scan line progression. The MSS sensor on Landsat 3 had five spectral bands, including Band 8, which was designed for thermal imaging but failed shortly after launch.
In early 1980, the MSS experienced an anomaly where the sensor had trouble properly synchronizing scan lines at the beginning of each new line, resulting in data gaps or inconsistencies at the start of each image. This affects about 1/3 of each Landsat 3 MSS image. Visit this page to learn more about the affects of this anomaly.
- 80-meter ground resolution in four spectral bands:
- Band 4 Visible green (0.5 to 0.6 µm)
- Band 5 Visible red (0.6 to 0.7 µm)
- Band 6 Near-Infrared (0.7 to 0.8 µm)
- Band 7 Near-Infrared (0.8 to 1.1 µm)
- Band 8 Thermal Infrared (10.4- to 12.6 µm) - failed shortly after launch
- Six detectors for each spectral band provided six scan lines on each active scan
- Ground Sampling Interval (pixel size): 57 x 79 m
- Scene size: 170 km x 185 km (106 mi x 115 mi)
Visit Landsat 1-5 MSS for more information.
*In 2011, the Memory of the World Programme, administered through the United Nations Educational, Scientific and Cultural Organization (UNESCO), selected the Landsat Multispectral Scanner (MSS) datasets to be included because they are unique, irreplaceable record of the Earth’s land surfaces, shallow coastal regions, and reefs.
Landsat 3 Spacecraft Facts
- Manufactured by General Electric (GE) Astrospace
- Weight: approximately 953 kg (2,100 lbs)
- Overall height: 3 m (10 ft)
- Diameter: 1.5 m (5 ft)
- Solar array paddles extend out to a total of 4 m (13 ft)
- 3-axis stabilized using 4 wheels to +/-0.7° attitude control
- Twin solar array paddles (single-axis articulation)
- S-Band and Very High Frequency (VHF) communications
- Hydrazine propulsion system with 3 thrusters
Additional Resources
Landsat 3 History (NASA Landsat Science)
The Multispectral Scanner (NASA Landsat Science)
Related
Spectral Bandpasses for all Landsat Sensors
This image shows the spectral bandpasses for the sensors on all Landsat satellites.

Landsat 3 First Light Image of San Jose
Landsat 3’s first image features a slice of Northern California on March 7, 1978.
Landsat 3’s first image features a slice of Northern California on March 7, 1978.

Landsat 3 First Light Image of Northern California
Landsat 3 First Light Image of Northern CaliforniaOne of Landsat 3’s first images, captured by the Multispectral Scanner (MSS) 4 days after launch, features a slice of Northern California on March 7, 1978. San Jose sits in Santa Clara Valley touching the southernmost portion of San Francisco. This image showcases the urbanization of the valley, which exploded in the 1970s as Silicon Valley grew.
Related
Spectral Bandpasses for all Landsat Sensors
This image shows the spectral bandpasses for the sensors on all Landsat satellites.
This image shows the spectral bandpasses for the sensors on all Landsat satellites.
Landsat 3 First Light Image of San Jose
Landsat 3’s first image features a slice of Northern California on March 7, 1978.
Landsat 3’s first image features a slice of Northern California on March 7, 1978.
Landsat 3 First Light Image of Northern California
Landsat 3 First Light Image of Northern CaliforniaOne of Landsat 3’s first images, captured by the Multispectral Scanner (MSS) 4 days after launch, features a slice of Northern California on March 7, 1978. San Jose sits in Santa Clara Valley touching the southernmost portion of San Francisco. This image showcases the urbanization of the valley, which exploded in the 1970s as Silicon Valley grew.