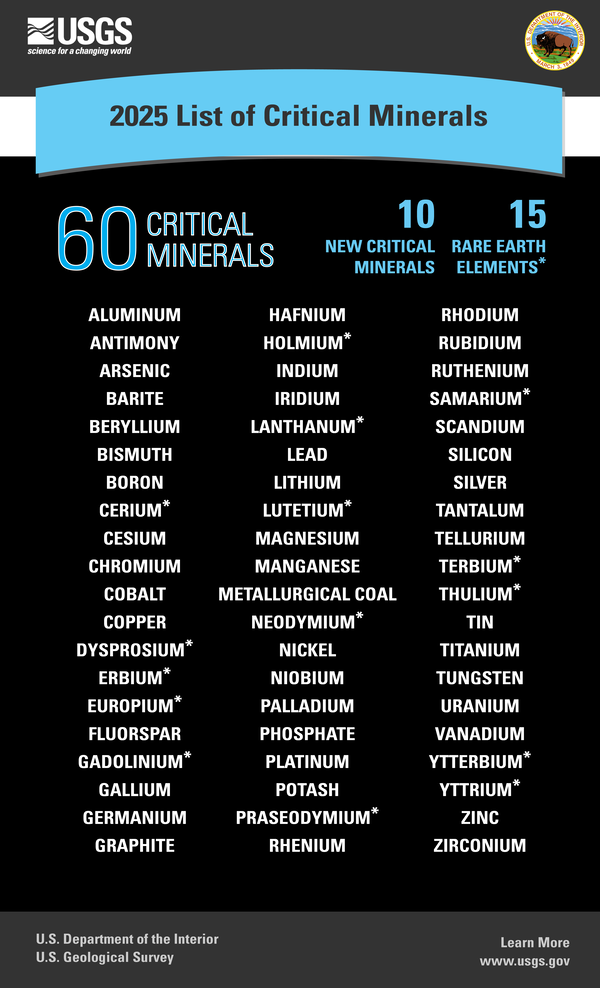
U.S. flag

An official website of the United States government

Images

Energy and Minerals Mission Area images.

Filter Total Items: 317
Infographic showing how energy and mineral resource research supports the transition to a low-carbon energy economy.
USGS science supports the low-carbon energy transition infographic

Our science is supporting the low-carbon energy transition.

Diagram showing the flow of water for conventional flotation processing of copper ores (Bleiwas, 2012)
Schematic Diagram of Water Flow for Conventional Flotation Processing of Copper Ores (Bleiwas, 2012)

Schematic diagram of water flow for conventional flotation processing of copper ores from Bleiwas, D.I., 2012, Estimated water requirements for the conventional flotation of copper ores: U.S. Geological Survey Open-File Report 2012–1089, 13 p., available at https://pubs.usgs.gov/publication/ofr20121089

Infographic summarizing the process through which the List of Critical Minerals is created. Click for full text.
The Process of Creating the List of Critical Minerals Infographic

USGS leads the government in developing the List of Critical Minerals. UGS is required to update the List at least once every three years. The process for developing the List of Critical Minerals is laid out in the Energy Act of 2020 (Section 7002). 


Process

Formulation and expert input

USGS leads the government in developing the List of Critical Minerals. UGS is required to update the List at least once every three years. The process for developing the List of Critical Minerals is laid out in the Energy Act of 2020 (Section 7002). 


Process

Formulation and expert input

Infographic on the methodology used to create the List of Critical Minerals. Click for full text.
Mineral Supply Risk Analysis for the 2022 List of Critical Minerals Infographic

Mineral Supply Risk Analysis for the 2022 List of Critical Minerals

The USGS leads the government in developing the List of Critical Minerals, using a data-driven methodology to assess mineral supply risk.

Critical minerals are essential the Nation’s economy and security, and have supply chains vulnerable to disruption. 

Infographic showing accomplishments from Earth MRI's first five years. Click for full text.
Earth MRI First Five Years Accomplishments

Earth MRI: The First Five Years

The Earth Mapping Resources Initiative (Earth MRI) is modernizing the Nation’s mapping and geoscience data, benefitting regions, states and local communities.


By the Numbers:

40 States and Territories partnered with Earth MRI

Earth MRI: The First Five Years

The Earth Mapping Resources Initiative (Earth MRI) is modernizing the Nation’s mapping and geoscience data, benefitting regions, states and local communities.


By the Numbers:

40 States and Territories partnered with Earth MRI

Map of the US, Alaska and Puerto Rico filled in by data type: geophysics, geologic mapping, geochemistry, Lidar, Mine Wastes, hyperspectral.
Earth MRI Progress Map 2024

Map showing Earth MRI data acquisitions from select years. See all acquisitions here. 

Map of the US, Alaska and Puerto Rico filled in by data type: geophysics, geologic mapping, geochemistry, Lidar, Mine Wastes, hyperspectral.
Earth MRI Progress Map 2023

Map showing Earth MRI data acquisitions from select years. See all acquisitions here. 

Map of the US, Alaska and Puerto Rico filled in by data type: geophysics, geologic mapping, geochemistry, Lidar, Mine Wastes, hyperspectral.
Earth MRI Progress Map 2019

Map showing Earth MRI data acquisitions from select years. See all acquisitions here. 

Map of the US, Alaska and Puerto Rico filled in by data type: geophysics, geologic mapping, geochemistry, Lidar, Mine Wastes, hyperspectral.
Earth MRI Progress Map 2021

Map showing Earth MRI data acquisitions from 2019-2021. See all acquisitions here. 

Map of the US, Alaska and Puerto Rico filled in by data type: geophysics, geologic mapping, geochemistry, Lidar, Mine Wastes, hyperspectral.
Earth MRI Progress Map 2022

Map showing Earth MRI data acquisitions from select years. See all acquisitions here. 

Map of the US, Alaska and Puerto Rico filled in by data type: geophysics, geologic mapping, geochemistry, Lidar, Mine Wastes, hyperspectral.
Earth MRI Progress Map 2020

Map showing Earth MRI data acquisitions from select years. See all acquisitions here. 

Gray splotches showing parts of the US that are part of a mineral system.
Earth MRI Mineral Systems Map Gray

Map showing areas within the 23 mineral systems identified by the Mineral Resources Program and Earth Mapping Resources Initiative (Earth MRI).

Map showing areas within the 23 mineral systems identified by the Mineral Resources Program and Earth Mapping Resources Initiative (Earth MRI).

Map of the US with Alaska and Puerto Rico with many colorful splotches across it.
Earth MRI Mineral Systems Map Colorful

Map showing the 23 mineral systems identified by the Mineral Resources Program and Earth Mapping Resources Initiative (Earth MRI)

Map showing the 23 mineral systems identified by the Mineral Resources Program and Earth Mapping Resources Initiative (Earth MRI)

GIF showing data acquisition increases from 2019-2024 of Earth MRI mapping data within the US, Alaska and Puerto Rico.
Earth MRI Progress GIF

Gif showing increases in Earth MRI mapping data from 2019-2024. You can find all Earth MRI data acquisitions here

Gif showing increases in Earth MRI mapping data from 2019-2024. You can find all Earth MRI data acquisitions here

Pie Chart Showing Leading Copper Producing States in the U.S. in 2019
Pie Chart Showing Relative Amounts of Copper Produced in Leading Copper Producing States in 2019

Pie chart showing relative amounts of copper produced by leading copper producing states in the U.S. in 2019 (derived from data in Flanagan, D.M., 2019, Copper, in Metals and minerals: U.S. Geological Survey Minerals Yearbook 2019, v. 1, p. 20.1-20.30.

Pie chart showing relative amounts of copper produced by leading copper producing states in the U.S. in 2019 (derived from data in Flanagan, D.M., 2019, Copper, in Metals and minerals: U.S. Geological Survey Minerals Yearbook 2019, v. 1, p. 20.1-20.30.

Map showing global porphyry copper deposits from John and others (2010)
Porphyry.Copper.Map_.John_.and_.Others.2010.jpg

Global map showing locations of porphyry copper deposits from John, D.A., Ayuso, R.A., Barton, M.D., Blakely, R.J., Bodnar, R.J., Dilles, J.H., Gray, Floyd, Graybeal, F.T., Mars, J.C., McPhee, D.K., Seal, R.R., Taylor, R.D., and Vikre, P.G., 2010, Porphyry copper deposit model, chap. B of Mineral deposit models for resource assessment: U.S.

Global map showing locations of porphyry copper deposits from John, D.A., Ayuso, R.A., Barton, M.D., Blakely, R.J., Bodnar, R.J., Dilles, J.H., Gray, Floyd, Graybeal, F.T., Mars, J.C., McPhee, D.K., Seal, R.R., Taylor, R.D., and Vikre, P.G., 2010, Porphyry copper deposit model, chap. B of Mineral deposit models for resource assessment: U.S.

Ray Copper Mine, Kearney, Pinal County, Arizona, revised from Mark Coker (USGS Emeritus) 2007 photograph
Ray_copper_mine_USGS_Mark_Cocker_revised_Aug_30_2024.jpg

Photograph of Ray Copper Mine, Arizona, taken by USGS Emeritus Mark Coker, September 1, 2007. Revised for USGS Webpage carousel for brightness, sharpness, contrast, color saturation, and cropping.

Photograph of Ray Copper Mine, Arizona, taken by USGS Emeritus Mark Coker, September 1, 2007. Revised for USGS Webpage carousel for brightness, sharpness, contrast, color saturation, and cropping.

Map showing locations of producing copper mines in the Lower Colorado River Basin in 2024
Copper.mine_.locations.lower_.colorado.river_.basin_.2024.jpg

Map showing locations of copper producing mines in the Lower Colorado River Basin, produced by Eric Anderson of the Geology, Geophysics, and Geochemistry Science Center on August 19, 2024.

Map showing locations of copper producing mines in the Lower Colorado River Basin, produced by Eric Anderson of the Geology, Geophysics, and Geochemistry Science Center on August 19, 2024.

Leading Copper Producing States in 2020
Copper.production.by_.US_.state_.pie_.chart_.2020.jpg

Pie chart showing copper production in leading copper producing U.S. states in 2020 by Eric Anderson of the Geology, Geophysics, and Geochemistry Science Center, August 2024

Pie chart showing copper production in leading copper producing U.S. states in 2020 by Eric Anderson of the Geology, Geophysics, and Geochemistry Science Center, August 2024

Was this page helpful?