U.S. flag

An official website of the United States government

Images

Explore water-related photography, imagery, and illustrations.

Filter Total Items: 2553
Walkthrough of using mobile interface for the River DroughtCast
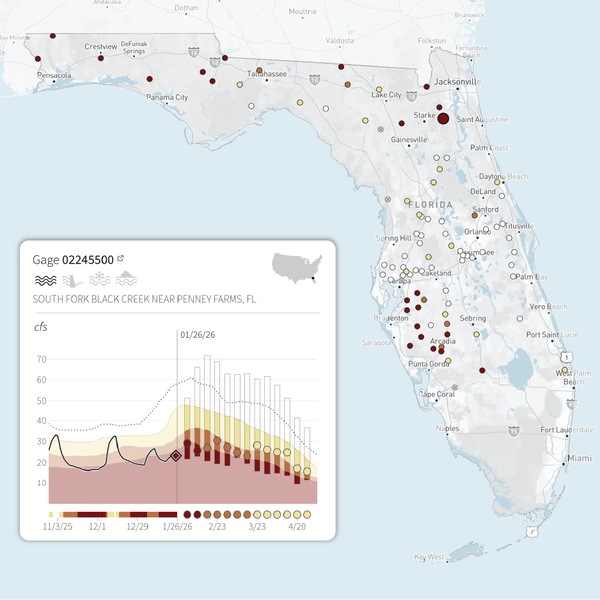
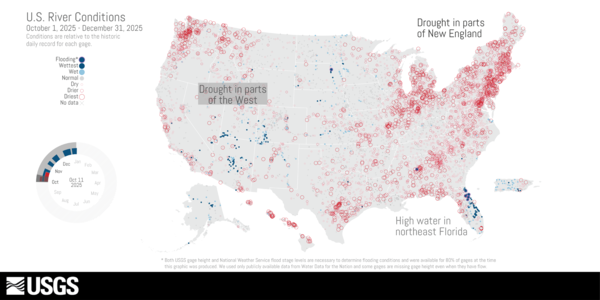
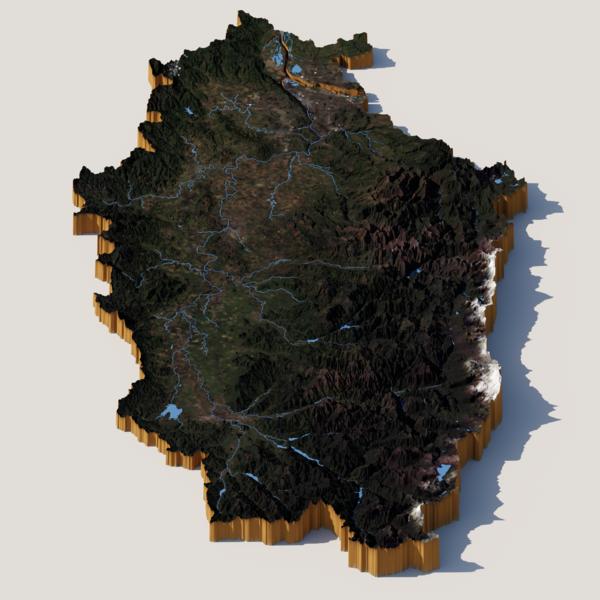
River DroughtCast mobile video capture March 17, 2026

River DroughtCast is a new machine learning system that predicts streamflow droughts — specifically “streamflow” droughts when rivers and streams drop to unusually low levels— up to 90 days in advance. Each prediction comes with uncertainty information to help users understand the confidence level of the forecast.

River DroughtCast is a new machine learning system that predicts streamflow droughts — specifically “streamflow” droughts when rivers and streams drop to unusually low levels— up to 90 days in advance. Each prediction comes with uncertainty information to help users understand the confidence level of the forecast.

Diagram of a Typical Streamgage Installation With Equipment
Screenshot of River DroughtCast zoomed into Florida with an example gage
River DroughtCast streamflow drought status and forecasts

River DroughtCast delivers current streamflow drought conditions and weekly forecasts of streamflow drought at select streamgages with long-term, complete records across the lower 48 states (the conterminous U.S., or CONUS).

River DroughtCast delivers current streamflow drought conditions and weekly forecasts of streamflow drought at select streamgages with long-term, complete records across the lower 48 states (the conterminous U.S., or CONUS).

Image of man in hiviz gear taking measurements
Groundwater quality measurements in MN

USGS scientist takes measurements of groundwater quality from a monitoring well near Zimmerman, Minnesota.

Image of man with water sample near a mobile lab in a open forest
Groundwater quality measurements at a mobile lab

Oklahoma-Texas Water Science Center Hydrologic Technician Dwight Sparks purges a monitoring well in Austin Texas to ensure stable field parameters before collecting a groundwater sample.

Oklahoma-Texas Water Science Center Hydrologic Technician Dwight Sparks purges a monitoring well in Austin Texas to ensure stable field parameters before collecting a groundwater sample.

USGS van and mobile groundwater sampling site
Mobile groundwater quality lab and USGS van

Oklahoma-Texas Water Science Center Hydrologic Technician Sam Matschek processes a groundwater sample at a monitoring well in Austin Texas. This groundwater sampling effort was to quantify geogenic contaminations in groundwater aquifers.

Oklahoma-Texas Water Science Center Hydrologic Technician Sam Matschek processes a groundwater sample at a monitoring well in Austin Texas. This groundwater sampling effort was to quantify geogenic contaminations in groundwater aquifers.

Screenshot of the Water Data for the Nation homepage highlighting 6 core ways to interact with USGS water data
Water Data for the Nation (WDFN) homepage

Screenshot of the Water Data for the Nation (WDFN) homepage. WDFN is the home for USGS's modernization of public delivery of water data. USGS water data can be accessed in many ways:

Screenshot of the Water Data for the Nation (WDFN) homepage. WDFN is the home for USGS's modernization of public delivery of water data. USGS water data can be accessed in many ways:

A hydrographer providing a written description of a flagged high-water mark using a white board.
Hydrographer provides a written description of a flagged high-water mark
Map of U.S. River Conditions, October to December 2025
U.S. River Conditions, October to December 2025

U.S. River Conditions, October to December 2025 thumbnail image. The river conditions shown range from the driest condition seen at a gage (red open circles) to the wettest (blue closed circles). A purple outer ring around a gage indicates it is flooding

U.S. River Conditions, October to December 2025 thumbnail image. The river conditions shown range from the driest condition seen at a gage (red open circles) to the wettest (blue closed circles). A purple outer ring around a gage indicates it is flooding

USGS Selenium Research Laboratory scientist collecting samples on the Kootenai River.
USGS Selenium Research Laboratory Scientist on the Kootenai River

A USGS scientist from Selenium Research Laboratory collecting samples on the Kootenai River during field work in 2025.

USGS scientists processing water samples from the Kootenai River.
USGS Scientists Processing Samples on the Kootenai River

USGS scientists processing samples taken from the Kootenai River during field work in 2025.

Images that represent downloading integrated water data
National Water Availability Assessment Data Companion capabilities

Images representing three of the services available to users of the National Water Availability Assessments (NWAA) Data Companion. Services include subset and download tool, data file directory, and web services. 

Map of U.S. River Conditions, July to September 2025
U.S. River Conditions, July to September 2025

U.S. River Conditions, July to September 2025 thumbnail image. The river conditions shown range from the driest condition seen at a gage (red open circles) to the wettest (blue closed circles). A purple outer ring around a gage indicates it is flooding.

U.S. River Conditions, July to September 2025 thumbnail image. The river conditions shown range from the driest condition seen at a gage (red open circles) to the wettest (blue closed circles). A purple outer ring around a gage indicates it is flooding.

Art of Inquiry show hosted at USGS on 22 September, 2025 as part of Flagstaff Festival of Science and in collaboration with Flagstaff Arts and Leadership Academy
FALA USGS art show Sept 2025.jpg

Art of Inquiry show hosted at USGS on 22 September, 2025 as part of Flagstaff Festival of Science and in collaboration with Flagstaff Arts and Leadership Academy

Was this page helpful?