
Mapping Water
Mapping Water
Filter Total Items: 37

Integrated Water Science (IWS) Basins
The U.S. Geological Survey is integrating its water science programs to better address the Nation’s greatest water resource challenges. At the heart of this effort are plans to intensively study several Integrated Water Science (IWS) basins—medium-sized watersheds (10,000-20,000 square miles) and underlying aquifers—over the next decade. The IWS basins will represent a wide range of environmental...

Next Generation Water Observing System (NGWOS)
The Next Generation Water Observing System (NGWOS) supports water availability assessments, management, and prediction by enhancing water observations in basins that represent major U.S. hydrologic regions. NGWOS provides high-resolution, real-time data on water quantity, quality, and use, as well as advance the development and application of new sensor technologies and remote sensing methods.
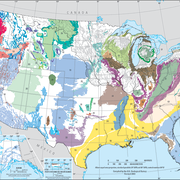
Principal Aquifers of the United States
This website compiles USGS resources and data related to principal aquifers including Aquifer Basics, principal aquifers maps and GIS data, and the National Aquifer Code Reference List.

Powder River: Data for Cross-Channel Profiles at 22 Sites in Southeastern Montana, 1975 through 2019
Powder River rises in the Bighorn Mountains of Wyoming and flows northward through a semi-arid landscape in Wyoming and Montana to the Yellowstone River. The river drains an area of 34,700 square kilometers and has an average discharge of about 500 million cubic meters per year. Cross-channel profile data were collected at 22 sites on the river and its tributaries from 1975 through 2014.

International Water Resources Activities
USGS water-related projects of international interest.

SPARROW Mappers
SPARROW mappers are interactive tools that allow the user to explore river streamflow and nutrient and sediment loads and yields and the importance of different sources of contaminants in a particular river basin. Data can be visualized using maps and interactive graphs and tables, and rankings can be shown by state, major watershed, hydrologic unit (HUC), and catchment.
Water Data Visualizations
Water data visualizations are provocative visuals and captivating stories that inform, inspire, and empower people to address our Nation's most pressing water issues. USGS data science and visualization experts use visualizations to communicate water data in compelling and often interactive ways when static images or written narrative can’t effectively communicate the interconnectivity and...

Shingobee Headwaters Aquatic Ecosystems Project (SHAEP)
For 43 years, the Shingobee Headwaters Aquatic Ecosystems Project (SHAEP) brought together scientists from the USGS along with students and professors from universities in Minnesota, North Dakota, Wisconsin, and California to study the physical, chemical, and biological processes of lakes, wetlands, and streams at local and watershed scales. In early 2022, The University of Minnesota and Bemidji...

Harmful Algal Bloom (HAB): Cooperative Matching Funds Projects
New projects from coast to coast will advance the research on harmful algal blooms (HABs) in lakes, reservoirs and rivers. The vivid emerald-colored algal blooms are caused by cyanobacteria, which can produce cyanotoxins that threaten human health and aquatic ecosystems and can cause major economic damage.

Rapid Deployment Gages (RDGs)
Rapid Deployment Gages (RDGs) are fully-functional streamgages designed to be deployed quickly and temporarily to measure and transmit stream stage data in emergency situations.

StreamStats
StreamStats provides access to spatial analytical tools that are useful for water-resources planning and management, and for engineering and design purposes. The map-based user interface can be used to delineate drainage areas, get basin characteristics and estimates of flow statistics, and more. Available information varies from state to state.

National Water-Quality Assessment (NAWQA)
Our surface water, groundwater, and aquatic ecosystems are priceless resources, used by people across the Nation for drinking, irrigation, industry, and recreation. The National Water-Quality Assessment (NAWQA) Project is a leading source of scientific data and knowledge for development of science-based policies and management strategies to improve and protect our water resources.