



SPARROW modeling: Estimating nutrient, sediment, and dissolved solids transport
Dynamic SPARROW models
National models estimate seasonal nutrients over 21 years in rivers across the U.S.
SPARROW Mappers
Modeling streamflow, nitrogen, phosphorus, and suspended sediments in streams across five regions of the United States
RSPARROW: An R system for SPARROW modeling
RSPARROW provides an open-source version of the USGS SPARROW water-quality model
SPARROW (SPAtially Referenced Regression On Watershed attributes) models estimate the amount of a contaminant transported from inland watersheds to larger water bodies by linking monitoring data with information on watershed characteristics and contaminant sources. Interactive, online SPARROW mapping tools allow for easy access to explore relations between human activities, natural processes, and contaminant transport.
Upper Colorado River Basin Streamflow Models
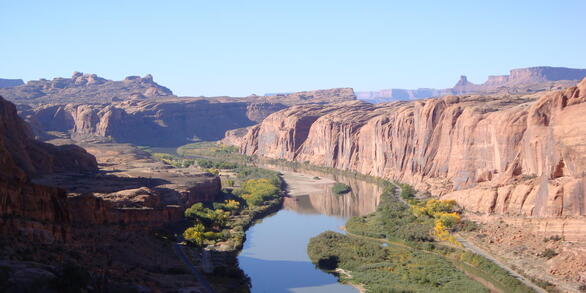
Over the study period, baseflow index (BFI) declined in headwaters and increased at mid-elevations. Springtime increases in BFI demonstrate the increasingly important role baseflow plays in water supply. Identifying the sources, locations, and timing of water that contributed to the UCRB outlet can inform management of water resources in the basin.
Illinois River Basin Dynamic Models
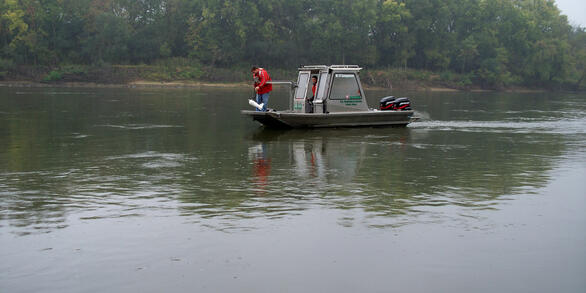
Seasonally varying contributions of contemporaneous and lagged sources of instream total nitrogen and phosphorus load across the Illinois River basin.
Integration of monitoring and modeling is critical to our future understanding and management of the Nation’s water quality. Monitoring is the direct observation, often over time, of water-quality properties and characteristics, and models are tools for interpreting these observations.
SPARROW models are used to estimate long-term average and time-varying values of water characteristics, such as the amount of a contaminant that is delivered downstream, based on existing monitoring data, location and strength of contaminant sources, and characteristics of the landscape.
SPARROW models can help managers:
- Determine options for reducing loads of contaminants
- Design strategies for protection or to meet regulatory requirements
- Predict changes in water quality that might result from management actions
- Identify gaps and priorities in monitoring network design

SPARROW Mappers
SPARROW mappers are interactive tools that allow the user to explore river nutrient loads and yields and the importance of different sources of contaminants in a particular river basin.
Data can be visualized using maps and interactive graphs and tables, and rankings can be shown by catchment, watershed, and state. Modeling results can be exported as an Excel spreadsheet, CSV file, or a geospatial dataset.
New mappers, representing circa 2012 source inputs, are available for 5 regions of the conterminous United States. The Mappers replace the SPARROW Decision Support System (Booth and others, 2011).
National Models
SPARROW models are unique in that they retain the spatial detail of underlying data sets while extending over areas as large as the conterminous United States. This allows the simultaneous assessment of water-quality conditions in many water bodies. National SPARROW models have been developed for a number of water-quality constituents including nutrients and total dissolved solids.
Regional Models
SPARROW models are flexible—they can be applied to any region where there are specific needs for water-quality information and where data to support modeling are abundant. Five new regional models of streamflow, total nitrogen, total phosphorus and suspended sediment have been developed for the conterminous United States. Other regional models have been developed previously for the Chesapeake Bay, Mississippi River and the Great Lakes watersheds. Regional models also exist for the Puget Sound (dynamic nutrients), Illinois River Basin (dynamic nutrients), and Upper Colorado River Basin (dynamic total dissolved solids, baseflow, and streamflow).
International Models
SPARROW models can be applied in any part of the world where sufficient data are available to support model development. Examples include models developed for New Zealand to identify the primary sources of nutrients to streams (Alexander and others, 2002), and a joint U.S.-Canadian effort to build nutrient models for the entire Great Lakes watershed, to better understand nutrient loading to the lakes (Robertson and others, 2019). More recently, the first Brazilian application of SPARROW used the open‑source RSPARROW tool to quantify the origin, flux, and fate of total nitrogen in two sub‑basins of the Grande River Basin (Miller and others, 2020).
Applications of SPARROW models
Once built and calibrated, SPARROW models can be applied in a variety of ways to better understand the environmental factors affecting water-quality conditions in streams.
- SPARROW and the RSPARROW mapping tool were applied to assist with the development and evaluation of management action scenarios aimed at reducing nutrient pollution and eutrophication (https://www.mdpi.com/2073-4441/12/10/2911)
- SPARROW models were applied at the national scale to estimate natural background levels of nutrients to help guide the potential development of nutrient criteria in streams.
- A model developed for the upper Midwest was used to identify the benefits of management practices designed to limit the amount of agricultural nutrients reaching streams (Garcia and others, 2016).
- A Chesapeake Bay SPARROW model was used to identify those areas that export nitrogen to streams with the greatest efficiency (Ator and Garcia, 2016).
- A SPARROW model was used to simulate impacts of climate change on phosphorus load to Lake Michigan (Robertson and others, 2016) and streamflow and baseflow in the Upper Colorado River Basin (Miller and others, 2021a, Miller and others, 2021b)
Databases
The national data bases used in the SPARROW models have value in themselves and can be used for other scientific evaluations. Attributes, such as point sources discharges, agricultural fertilizer / manure nutrients, atmospheric deposition, climate, geology / soils, land cover, hydrologic characteristics and physical characteristics, are available for all catchments in the RF1 and NHDPlus digital stream networks.
Stream network datasets and watershed attribute data
- The EPA RF1 data set (with attributes) is defined at the 1:500K scale and has stream catchments that are on average 130 km2.
- The NHDPlus data set (with attributes Version 1.1 and Version 2.1) is defined at the 1:100K scale and has stream catchments that are on average 3 km2.
- The GenNet digital stream network is available from Schwarz and others (2026).
- National scale seasonal model input data are available from Schmadel and others (2026).
Descriptions of these data sets and how they are used in SPARROW models can be found in Preston and others (2011).
What’s New …
- RSPARROW, now available on the USGS GitLab repository, provides the first open-source version of the USGS SPARROW water-quality model, with new features that improve the utility of the model for conducting studies of contaminants in surface waters and informing water resource management decisions. RSPARROW extends the capabilities of the current proprietary SAS SPARROW version and streamlines user and R developer access to SPARROW modelling technology. RSPARROW is being updated to account for temporary storage of contaminants.
- Although SPARROW models are typically based on a single time period for spatial representation, dynamic versions of SPARROW models have been developed to take advantage of new data sets and capabilities. Dynamic SPARROW models account for temporary storage of contaminants and simulate seasonal variations over long time periods (CONUS, IRB, UCOL publications one and two). They also allow simulation of contaminant loads through time to estimate the delay expected for management actions on the land to affect loads in streams.

Everything you need to know about SPARROW
SPARROW (SPAtially Referenced Regression On Watershed attributes) models estimate the amount of a contaminant transported from inland watersheds to larger water bodies by linking monitoring data with information on watershed characteristics and contaminant sources. Interactive, online SPARROW mapping tools allow for easy access to explore relations between human activities, natural processes, and contaminant transport.
Upper Colorado River Basin Streamflow Models
Over the study period, baseflow index (BFI) declined in headwaters and increased at mid-elevations. Springtime increases in BFI demonstrate the increasingly important role baseflow plays in water supply. Identifying the sources, locations, and timing of water that contributed to the UCRB outlet can inform management of water resources in the basin.
Illinois River Basin Dynamic Models
Seasonally varying contributions of contemporaneous and lagged sources of instream total nitrogen and phosphorus load across the Illinois River basin.
Integration of monitoring and modeling is critical to our future understanding and management of the Nation’s water quality. Monitoring is the direct observation, often over time, of water-quality properties and characteristics, and models are tools for interpreting these observations.
SPARROW models are used to estimate long-term average and time-varying values of water characteristics, such as the amount of a contaminant that is delivered downstream, based on existing monitoring data, location and strength of contaminant sources, and characteristics of the landscape.
SPARROW models can help managers:
- Determine options for reducing loads of contaminants
- Design strategies for protection or to meet regulatory requirements
- Predict changes in water quality that might result from management actions
- Identify gaps and priorities in monitoring network design
SPARROW Mappers
SPARROW mappers are interactive tools that allow the user to explore river nutrient loads and yields and the importance of different sources of contaminants in a particular river basin.
Data can be visualized using maps and interactive graphs and tables, and rankings can be shown by catchment, watershed, and state. Modeling results can be exported as an Excel spreadsheet, CSV file, or a geospatial dataset.
New mappers, representing circa 2012 source inputs, are available for 5 regions of the conterminous United States. The Mappers replace the SPARROW Decision Support System (Booth and others, 2011).
National Models
SPARROW models are unique in that they retain the spatial detail of underlying data sets while extending over areas as large as the conterminous United States. This allows the simultaneous assessment of water-quality conditions in many water bodies. National SPARROW models have been developed for a number of water-quality constituents including nutrients and total dissolved solids.
Regional Models
SPARROW models are flexible—they can be applied to any region where there are specific needs for water-quality information and where data to support modeling are abundant. Five new regional models of streamflow, total nitrogen, total phosphorus and suspended sediment have been developed for the conterminous United States. Other regional models have been developed previously for the Chesapeake Bay, Mississippi River and the Great Lakes watersheds. Regional models also exist for the Puget Sound (dynamic nutrients), Illinois River Basin (dynamic nutrients), and Upper Colorado River Basin (dynamic total dissolved solids, baseflow, and streamflow).
International Models
SPARROW models can be applied in any part of the world where sufficient data are available to support model development. Examples include models developed for New Zealand to identify the primary sources of nutrients to streams (Alexander and others, 2002), and a joint U.S.-Canadian effort to build nutrient models for the entire Great Lakes watershed, to better understand nutrient loading to the lakes (Robertson and others, 2019). More recently, the first Brazilian application of SPARROW used the open‑source RSPARROW tool to quantify the origin, flux, and fate of total nitrogen in two sub‑basins of the Grande River Basin (Miller and others, 2020).
Applications of SPARROW models
Once built and calibrated, SPARROW models can be applied in a variety of ways to better understand the environmental factors affecting water-quality conditions in streams.
- SPARROW and the RSPARROW mapping tool were applied to assist with the development and evaluation of management action scenarios aimed at reducing nutrient pollution and eutrophication (https://www.mdpi.com/2073-4441/12/10/2911)
- SPARROW models were applied at the national scale to estimate natural background levels of nutrients to help guide the potential development of nutrient criteria in streams.
- A model developed for the upper Midwest was used to identify the benefits of management practices designed to limit the amount of agricultural nutrients reaching streams (Garcia and others, 2016).
- A Chesapeake Bay SPARROW model was used to identify those areas that export nitrogen to streams with the greatest efficiency (Ator and Garcia, 2016).
- A SPARROW model was used to simulate impacts of climate change on phosphorus load to Lake Michigan (Robertson and others, 2016) and streamflow and baseflow in the Upper Colorado River Basin (Miller and others, 2021a, Miller and others, 2021b)
Databases
The national data bases used in the SPARROW models have value in themselves and can be used for other scientific evaluations. Attributes, such as point sources discharges, agricultural fertilizer / manure nutrients, atmospheric deposition, climate, geology / soils, land cover, hydrologic characteristics and physical characteristics, are available for all catchments in the RF1 and NHDPlus digital stream networks.
Stream network datasets and watershed attribute data
- The EPA RF1 data set (with attributes) is defined at the 1:500K scale and has stream catchments that are on average 130 km2.
- The NHDPlus data set (with attributes Version 1.1 and Version 2.1) is defined at the 1:100K scale and has stream catchments that are on average 3 km2.
- The GenNet digital stream network is available from Schwarz and others (2026).
- National scale seasonal model input data are available from Schmadel and others (2026).
Descriptions of these data sets and how they are used in SPARROW models can be found in Preston and others (2011).
What’s New …
- RSPARROW, now available on the USGS GitLab repository, provides the first open-source version of the USGS SPARROW water-quality model, with new features that improve the utility of the model for conducting studies of contaminants in surface waters and informing water resource management decisions. RSPARROW extends the capabilities of the current proprietary SAS SPARROW version and streamlines user and R developer access to SPARROW modelling technology. RSPARROW is being updated to account for temporary storage of contaminants.
- Although SPARROW models are typically based on a single time period for spatial representation, dynamic versions of SPARROW models have been developed to take advantage of new data sets and capabilities. Dynamic SPARROW models account for temporary storage of contaminants and simulate seasonal variations over long time periods (CONUS, IRB, UCOL publications one and two). They also allow simulation of contaminant loads through time to estimate the delay expected for management actions on the land to affect loads in streams.