
The USGS Hawaiian Volcano Observatory continues to closely monitor volcanoes and earthquakes on the Island of Hawai‘i. On this map, which shows earthquakes that occurred beneath the island between August 6, 2018, and November 14, 2018, the size of each circle depicts earthquake magnitude and color indicates earthquake depth, relative to mean sea level.
Images
Explore our planet through photography and imagery, including climate change and water all the way back to the 1800s when the USGS was surveying the country by horse and buggy.
Filter Total Items: 21356

earthquakes that occurred beneath the island
The USGS Hawaiian Volcano Observatory continues to closely monitor volcanoes and earthquakes on the Island of Hawai‘i. On this map, which shows earthquakes that occurred beneath the island between August 6, 2018, and November 14, 2018, the size of each circle depicts earthquake magnitude and color indicates earthquake depth, relative to mean sea level.

East end of Fire Island depicted with airborne imagery and lidar
East end of Fire Island depicted with airborne imagery and lidarEast end of Fire Island, showing white sandy beaches and marshes, depicted with airborne imagery, and lidar-derived bathymetric features in the estuary behind the island, in the offshore region, and in the channel connecting the estuary to the ocean.

Elevation data for land and submerged areas, Barnegat Bay, NJ
Elevation data for land and submerged areas, Barnegat Bay, NJCoastal storms can severely alter the topography and ecosystems along heavily populated coastal regions. Seamless integrated elevation data for both land and submerged areas in Barnegat Bay, New Jersey, are fundamental to coastal planning of the northeastern U.S. Atlantic coast.

Equipment set up at wind energy site
Bat detection and monitoring equipment set up below a turbine at an Oʻahu, Hawaiʻi wind energy site.
Bat detection and monitoring equipment set up below a turbine at an Oʻahu, Hawaiʻi wind energy site.

Explosive eruption columns of ash rising
Explosive eruption columns of ash rising from Halema‘uma‘u at 11:15 a.m. on May 18, 1924 (top) and at 11:05 a.m. on May 15, 2018 (bottom) look similar.
Explosive eruption columns of ash rising from Halema‘uma‘u at 11:15 a.m. on May 18, 1924 (top) and at 11:05 a.m. on May 15, 2018 (bottom) look similar.

Faults and features of the Big Sur area
Shaded-relief map of central California showing location of the Big Sur area (white dashed line). Red line shows the San Gregorio-Hosgri fault (SGHF) and the Big Sur Bend between Point Sur (PS) and Piedras Blancas (PB). Black lines show other faults.
Shaded-relief map of central California showing location of the Big Sur area (white dashed line). Red line shows the San Gregorio-Hosgri fault (SGHF) and the Big Sur Bend between Point Sur (PS) and Piedras Blancas (PB). Black lines show other faults.

Fieldwork in California’s Sacramento-San Joaquin River Delta
Fieldwork in California’s Sacramento-San Joaquin River DeltaTop row, left to right: Cordell Johnson (left) and Evan Dailey use the USGS R/V Fast Eddy to collect water samples. Cordell Johnson (left) and Jessie Lacy prepare to deploy a tripod holding instruments to measure water level, currents, and suspended sediment.

Fieldwork in Tanzania
Brian Miller, research ecologist for the NC CASC, on the road while doing fieldwork in Tanzania.
Brian Miller, research ecologist for the NC CASC, on the road while doing fieldwork in Tanzania.

Fissure 8 cone and 8-mile lava flow
An aerial view, collected from a USGS UAS, of Hawai‛i’s fissure 8 cone, and the start of the 8-mile lava flow to reach the ocean entry point.
An aerial view, collected from a USGS UAS, of Hawai‛i’s fissure 8 cone, and the start of the 8-mile lava flow to reach the ocean entry point.
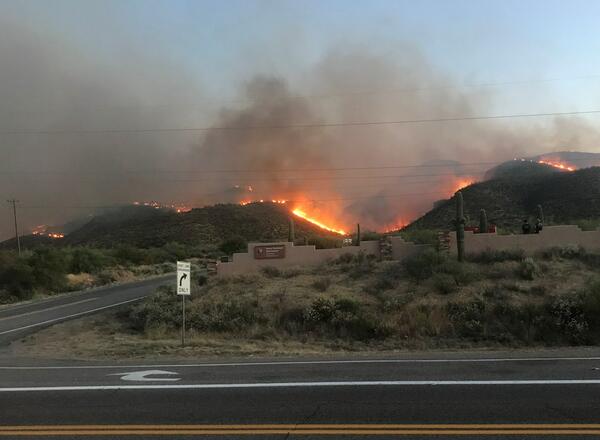
Flames from the Woodbury Fire rise above Tonto National Monument
Flames from the Woodbury Fire rise above Tonto National MonumentFlames from the Woodbury Fire rise above Tonto National Monument.
Flames from the Woodbury Fire rise above Tonto National Monument
Flames from the Woodbury Fire rise above Tonto National MonumentFlames from the Woodbury Fire rise above Tonto National Monument.

Florida Bay at Sunset, 2018
After a long day collecting cores, the team of scientists watch the sun set over the Florida Bay.
After a long day collecting cores, the team of scientists watch the sun set over the Florida Bay.

Gallinas Creek discharge measurement, USGS
Hydrologic Technician Chris Peskuski making a discharge measurement above Gallinas Creek near Montezuma, NM (site data available at: https://waterdata.usgs.gov/nm/nwis/uv?site_no=08380500)
Hydrologic Technician Chris Peskuski making a discharge measurement above Gallinas Creek near Montezuma, NM (site data available at: https://waterdata.usgs.gov/nm/nwis/uv?site_no=08380500)
Graduate Students Mounting and Reading Otoliths
State University of New York-Brockport graduate student, Tom Bianchi, interprets alewife otolith ages (foreground) while student contractor Scott Minihkiem (background) mounts otoliths in epoxy. Bianchi is evaluating how alewife age influences reproductive success and was trained in otolith techniques at the GLSC’s Lake Ontario Biological Station.
State University of New York-Brockport graduate student, Tom Bianchi, interprets alewife otolith ages (foreground) while student contractor Scott Minihkiem (background) mounts otoliths in epoxy. Bianchi is evaluating how alewife age influences reproductive success and was trained in otolith techniques at the GLSC’s Lake Ontario Biological Station.

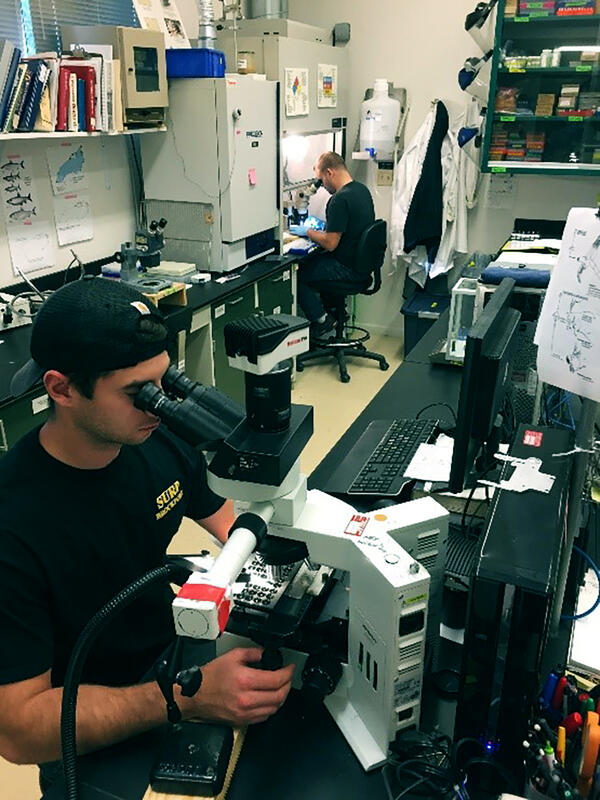
Grass Carp Eggs Under a Microscope
Grass Carp Eggs being examined under a microscope to determine developmental stage.
Grass Carp Eggs being examined under a microscope to determine developmental stage.

Groundwater withdrawals in 2015
Groundwater withdrawals in 2015

Headwaters of the Colorado River
The headwaters of the Colorado and Gunnison Rivers was selected in 2019 as an Integrated Water Science Basin.
The headwaters of the Colorado and Gunnison Rivers was selected in 2019 as an Integrated Water Science Basin.
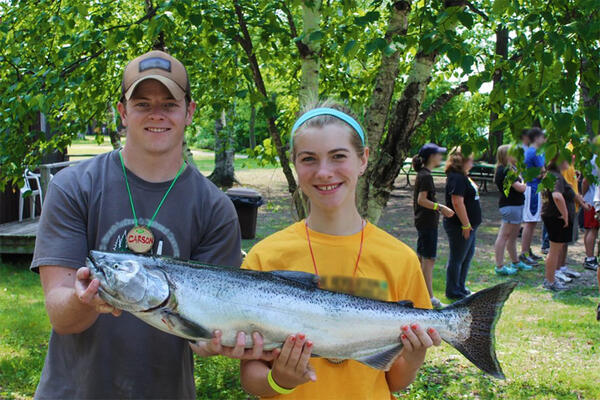
Holding a Chinook Salmon
Carson Pritchard (left), a former GLSC contractor and 4-H camp counselor, shows off a Great Lakes Chinook salmon with a 4-H camper. Alewife are the primary forage of Chinook salmon. Consequently, understanding alewife age dynamics helps fishery managers balance predator numbers with the available prey.
Carson Pritchard (left), a former GLSC contractor and 4-H camp counselor, shows off a Great Lakes Chinook salmon with a 4-H camper. Alewife are the primary forage of Chinook salmon. Consequently, understanding alewife age dynamics helps fishery managers balance predator numbers with the available prey.

hydrothermal area disturbs boardwalk passage in Yellowstone
hydrothermal area disturbs boardwalk passage in YellowstoneA section of the Porcelain Basin Loop boardwalk in the Norris Geyser Basin was removed because the ground below sections of the boardwalk became too hot and made charcoal of the wood footings that support the structure. Luckily enough in this case, the boardwalk was shifted about 3 feet to avoid the new hot ground.

Illustration describes a barrier island from ocean to lagoon
Illustration describes a barrier island from ocean to lagoonIllustration shows the cross-section of a barrier island progressing from ocean (on the right) to marsh and then lagoon (on the left).
Illustration describes a barrier island from ocean to lagoon
Illustration describes a barrier island from ocean to lagoonIllustration shows the cross-section of a barrier island progressing from ocean (on the right) to marsh and then lagoon (on the left).

Image collage of USGS Ecosystems Mission Area scientists in the field.
Image collage of USGS Ecosystems Mission Area scientists in the field.Image collage of USGS Ecosystems Mission Area scientists in the field.
Image collage of USGS Ecosystems Mission Area scientists in the field.
Image collage of USGS Ecosystems Mission Area scientists in the field.Image collage of USGS Ecosystems Mission Area scientists in the field.

Images of multiple oceanside beaches and dunes at Fire Island New York
Images of multiple oceanside beaches and dunes at Fire Island New YorkFor more than 15 years, the USGS has actively studied natural and human changes to the shoreline, beaches, and dunes at Fire Island.
Images of multiple oceanside beaches and dunes at Fire Island New York
Images of multiple oceanside beaches and dunes at Fire Island New YorkFor more than 15 years, the USGS has actively studied natural and human changes to the shoreline, beaches, and dunes at Fire Island.