
Wind driven snow transport across the glacier surface near site Y on upper Wolverine Glacier.
Wolverine Glacier is located in the high-latitude maritime climate regime of Alaska’s Kenai Mountains. Glacier observations began at this site in 1966.
Return to Glaciers and Landscape Change
Media

Sources/Usage: Public Domain. View Media Details
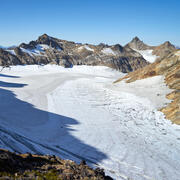
Wolverine Glacier is in the Kenai Mountains on the coast of south-central Alaska. The climate is maritime, characterized by low temperature variability and heavy, regular precipitation. Wolverine Glacier has a southerly aspect, with a narrow terminus at 450 m and a broad head up to 1680 m. In 2018 the Glacier was approximately 7 km long, and encompassed an area of 15.6 km2 in its 24.5 km2 basin (O'Neel et al, 2019).
In 1966 scientists with the USGS began making direct measurements of surface mass balance at Wolverine Glacier, one of two "benchmark glaciers" in Alaska. Repeated measurements at three long-term "index" sites, in conjunction with local meteorology and runoff data, are used to estimate glacier-wide mass balances. These data constitute the longest continuous set of mass-balance data in North America (Josberger and others, 2007) which are used to understand glacier dynamics and hydrology, and to understand the glacier's response to climate change.
Research
Media

Sources/Usage: Public Domain. View Media Details
Glacier mass balance
In 1966 the U.S. Geological Survey began direct measurements of surface mass balance at Wolverine Glacier (Mayo et al, 2003). After a decade of dense spatial sampling the measurements were reduced to three "index" sites distributed across the elevation range of the Glacier. Field visits to measure and maintain stakes at the three index sites are made each spring, at the onset of the melt season, and again in early autumn, near its completion. Density of the material gained or lost is measured with a snow-pit or core. By collecting data near the balance maxima and minima direct measurements closely reflect maximum winter snow accumulation and the annual balances at each location. Since 1975 both the stakes and the glacier surface elevations at the actual index sites have been surveyed to allow calculations of velocity and surface elevation change.
Direct field measurements are combined with weather data and imagery analyses to calculate the seasonal and annual mass balance of each glacier. Access all the data here.
Meteorologic
Meteorological observations began in 1967 with installation of temperature and precipitation instruments. Today the stations are telemetered, and near real-time values of temperature (with both passive and actively ventilated shields), relative humidity, year-round precipitation (with known compromises in measuring snow), wind speed and direction, and solar radiation are publicly available. Recent changes to the program include installing modern precipitation gauges (Sutron) and installing new stations to directly measure lapse rates in each basin.
Media

Sources/Usage: Public Domain. View Media Details
Current data available from the Wolverine weather station (USGS 15236895) includes:
- Temperature, air
- Wind speed
- Wind direction
- Cumulative Precipitation
Instrument Site and Climate Description
The Wolverine weather station (60°23' N, 148°55' W) is located at an altitude of 990 meters (m) on a tundra knoll along the western boundary of the basin. The station is slightly lower than the glacier's average equilibrium line altitude and approximately 500 m from the west edge of the glacier. The average annual air temperature at the recorder site is about -1.0 degree Celsius(°C), and the average annual precipitation-gage catch is about 1,100 millimeters (mm) (recorded annual precipitation catch represents approximately 33 percent of actual annual basin precipitation due to the low catch efficiency for snowfall). Snowfall is the dominant form of precipitation and usually accumulates on the glacier from September through mid-June. Daily average temperatures range from a low of -25°C to a high of 15°C. Daily precipitation catch can be over 110 mm.
The original weather station had analogue instruments with strip-chart recorders. Daily average temperatures from that era have an accuracy of about ±1.0°C (Mayo, March, and Trabant, 1992; Kennedy, 1995). Daily precipitation records are complicated by thermal expansion of the antifreeze water solution. The annual precipitation record represents approximately 33 percent of actual annual basin precipitation due to limited catch efficiency during snowfall (Mayo and others, 1992). Starting in the late 1980's the station has been updated with progressively newer, more accurate, and more sensors.
Ridge-Top climate station
An additional weather station was installed at higher elevation in 2012. The ridge-top weather station (60°24' N, 148°57' W) is ~1 km west of the glacier at 1420 m. Measurements at this site include:
- Temperature (daily values available online)
- Relative Humidity
- Wind Speed
- Wind Direction
- Radiation (incoming & outgoing, shortwave & longwave)
Hydrologic
Media

Sources/Usage: Public Domain. View Media Details
The "Wolverine Creek near Lawing" stream-gaging station, USGS station 15236900, is part of the USGS network of nearly 100 stations in Alaska. Data collection and analysis are conducted by standard techniques developed by the USGS. Daily values of discharge are available online and reported in annual publications of the USGS Water-Data Report series.
Wolverine gaging station (USGS 15236900):
- Temperature, air
- Precipitation
- Stream Discharge
- Gage height
Location: Latitude 60°22'14"N., Longitude 148°53'48"W., 370 m altitude, in NE 1/4 sec.10, T.3 N., R.3 E., Hydrologic Unit 19020202, on left bank about 0.15 km downstream from terminus of Wolverine Glacier and 25 km east of Lawing, Alaska.
Drainage area: 24.5 km2
Period of record: October 1966 to September 1978, October 1980 to September 1981, May 1997 to September 1997, October 2000 to current.
NOTE: Records are poor. The creek bed is composed of poorly-sorted gravel and small boulders. The channel is subject to frequent changes during high flows. Large fluctuations from ice melt and alternative damming and storage release during the melt season.
Typical summer mean daily discharge is about 9 m3/s; the period-of-record instantaneous peak discharge was 51 m3/s on August 21, 1981 (Benson and others, 1998).
Previous Work
Measurements began on Wolverine Glacier in 1966 resulting in many reports and analysis among other benchmark glaciers. Detailed results from 1966 and 1967 are reported by Meier and others (1971) and Tangborn and others (1977), respectively. Ice and water balances for 1965/66 hydrologic years are reported by Meier et al. (1971). Measured winter snow balances and annual balances from 1966-77 are reported by Meier and others (1980).
Media

Sources/Usage: Public Domain. View Media Details
Since 1966, part of the Wolverine data set (net balance, accumulation, ablation, accumulation area ratio (AAR), and equilibrium line altitude (ELA)) has been published by the World Glacier Monitoring Service (Kasser, 1967; Muller, 1977; Haeberli, 1985; Haeberli and Müller, 1988; Haeberli and Hoelzle, 1993). Air temperature and precipitation data for 1967-1988 were published by Mayo, March and Trabant (1992) and summarized by Mayo and March (1990) and for 1994 by March (1998).
Regional Impacts
Wolverine Glacier is located in the Kenai Mountains of Alaska, 65 miles south of Anchorage. The glacier is located in a maritime climate, within the Nellie Juan river basin. Runoff drains into the Nellie Juan Fjord of Prince William Sound, approximately 9 miles east of the current glacier terminus. Glaciers in in the Gulf of Alaska influence the nearshore marine environment by providing a seasonal pulse of cold, sediment-rich freshwater, impacting coastal ecology and ocean currents. Changes in coastal Alaskan glaciers will have profound impacts on downstream areas, including river and fjord ecology, and nearshore ocean currents.
Selected Publications:
Beamer, J.P., D.F. Hill, D. McGrath, A. Arendt, and C. Kienholz, 2017, Hydrologic impacts of changes in climate and glacier extent in the Gulf of Alaska watershed, Water Resour. Res., 53, 7502–7520, doi:10.1002/2016WR020033.
O'Neel, S., et al., 2015, Icefield-to-ocean linkages across the Northern Pacific coastal temperate rainforest ecosystem, BioScience, 65, 499– 512, doi:10.1093/biosci/biv027.
Glaciers and Landscape Change
Mountain glaciers are dynamic reservoirs of frozen water, deeply interconnected with their surrounding ecosystems. Glacier change in North America has major societal impacts, including to water resources, natural hazard risk, tourism disruption, fisheries, and global sea level change. Understanding and quantifying precise connections between changing glaciers, the surrounding landscape and climate...
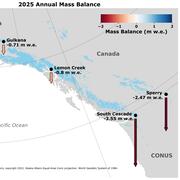
2025 USGS Benchmark Glaciers Executive Summary
2025 Data Now Available: Explore how the USGS Benchmark Glaciers have changed in 2025

Mass Balance Methods: Measuring Glacier Change
Nearly all of Earth's alpine glaciers are losing mass, with consequences for freshwater resources, landscape stability, regional ecosystems, and global sea level. Rates of glacier mass loss in Western North America and Alaska are among the highest on Earth (The GlaMBIE Team, 2025).

Additional Research Glaciers
The USGS Glacier Project has conducted research beyond the Benchmark Glaciers, both past and present. This work has focused on infrastructure hazards, rapid glacier change, landscape destabilization, and glacier dynamics and processes not captured by the Benchmark Glacier network. These glaciers include Black Rapids, Kahiltna, Kennicott, Columbia, Hubbard, and Taku.

Gulkana Glacier
Gulkana Glacier is located in the high-latitude continental climate regime of Alaska’s Delta Mountains. Glacier observations began at this site in 1966 and continue through present as the northern most USGS Benchmark Glacier.
Lemon Creek Glacier
Lemon Creek Glacier is located in the high-latitude maritime region of Alaska, at the southernmost tip of the Juneau Icefield. Glacier observations began at this site in 1953.
South Cascade Glacier
South Cascade Glacier is located in the midlatitude maritime climate of the North Cascade Mountains of Washington State. Glacier observations began at this site in 1958.

Sperry Glacier
Sperry Glacier is located along the Continental Divide within Glacier National Park, Montana. It represents the midlatitude continental or transitional climate. Glacier observations began at this site in 2005.

Wolverine Glacier Ecosystem Studies
This project is an extension of the long-term Wolverine Glacier Benchmark Glacier project and is improving our understanding of solutes and nutrients in glacier basins, and how they fuel downstream ecosystems.
Filter Total Items: 25
Zan Frederick (USGS) on upper Wolverine Glacier
Wind driven snow transport across the glacier surface near site Y on upper Wolverine Glacier.
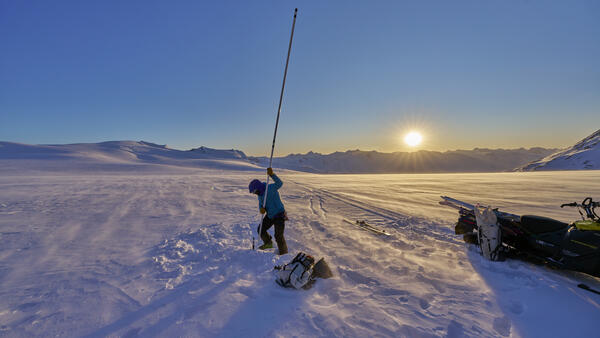
Zan Frederick (USGS) extending a mass balance stake
Zan Frederick (USGS) extending a mass balance stakeExtending a mass balance stake at site EC on upper wolverine glacier. These stakes are used to measure snow accumulation and ablation (melt).
Zan Frederick (USGS) extending a mass balance stake
Zan Frederick (USGS) extending a mass balance stakeExtending a mass balance stake at site EC on upper wolverine glacier. These stakes are used to measure snow accumulation and ablation (melt).
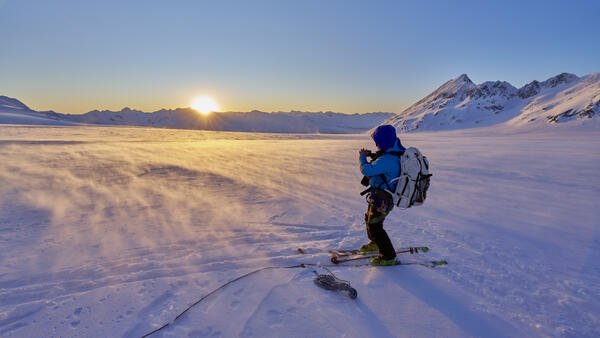
Zan Frederick (USGS) taking notes on Wolverine Glacier
Zan Frederick (USGS) taking notes on Wolverine GlacierTaking notes at site EC on Wolverine Glacier.
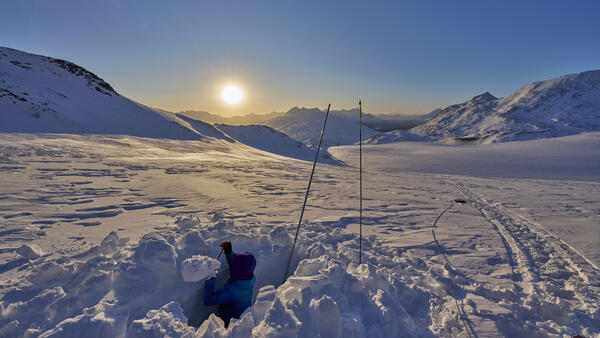
Zan Frederick (USGS) digging a snowpit
At site S on Wolverine Glacier. Zan digs down to the previous summer surface to see where the ablation stake intersects the melt surface. This will allow scientists to calculate the ablation (melt) from the previous summer.
At site S on Wolverine Glacier. Zan digs down to the previous summer surface to see where the ablation stake intersects the melt surface. This will allow scientists to calculate the ablation (melt) from the previous summer.
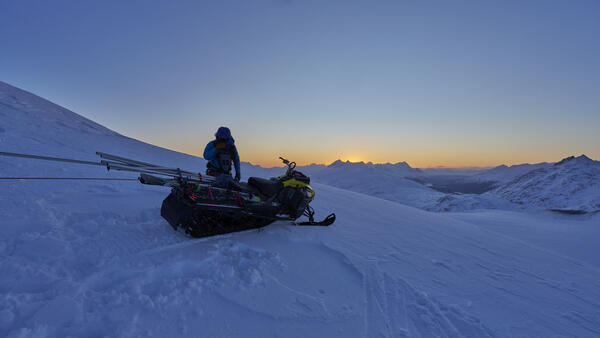
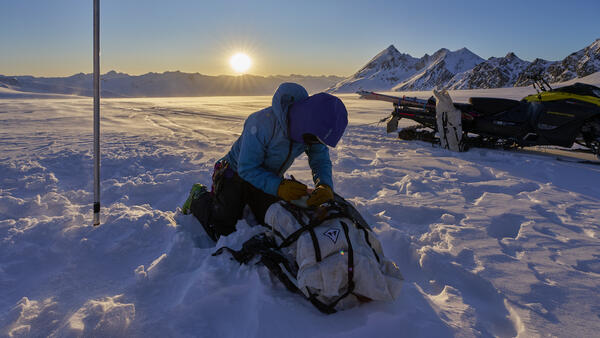
Zan Frederick (USGS) packing gear at sunset on Wolverine Glacier
Zan Frederick (USGS) packing gear at sunset on Wolverine GlacierBy 4:42 pm on December 13, the sun has set and it is time leave Wolverine Glacier.
Zan Frederick (USGS) packing gear at sunset on Wolverine Glacier
Zan Frederick (USGS) packing gear at sunset on Wolverine GlacierBy 4:42 pm on December 13, the sun has set and it is time leave Wolverine Glacier.
Zan Frederick (USGS) skiing down Wolverine Glacier to Paradise Lake
Zan Frederick (USGS) skiing down Wolverine Glacier to Paradise LakeThe wind was too strong for a helicopter to land, therefore, glaciologist skied down Wolverine Glacier to Paradise Lake.
Zan Frederick (USGS) skiing down Wolverine Glacier to Paradise Lake
Zan Frederick (USGS) skiing down Wolverine Glacier to Paradise LakeThe wind was too strong for a helicopter to land, therefore, glaciologist skied down Wolverine Glacier to Paradise Lake.

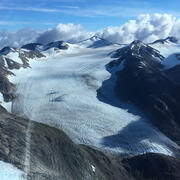
Timelapse imagery from Wolverine Glacier, Alaska (2012 - 2022)
Timelapse imagery from Wolverine Glacier, Alaska (2012 - 2022)The timelapse imagery provided here shows the lower half of Wolverine Glacier from 2012 to 2022. This imagery gives an intuitive view of the scale of change happening at glaciers across Alaska.

Sun setting on weather station at Wolverine Glacier
Sun setting on weather station at Wolverine GlacierRemote weather stations, like this one at Wolverine Glacier, collect data near each glacier so scientists can understand regional climate influence on the glaciers.
Sun setting on weather station at Wolverine Glacier
Sun setting on weather station at Wolverine GlacierRemote weather stations, like this one at Wolverine Glacier, collect data near each glacier so scientists can understand regional climate influence on the glaciers.

Scientist with data notebook
Scientist uses radio-echo-sounding to study firn compaction on Wolverine Glacier, Alaska. Radio-echo sounding (RES) is a technique used by glaciologists to measure the internal structure, ice thickness and sub-ice morphology of glaciers. This tool is equivalent to X-rays for the medical profession and the physicists.
Scientist uses radio-echo-sounding to study firn compaction on Wolverine Glacier, Alaska. Radio-echo sounding (RES) is a technique used by glaciologists to measure the internal structure, ice thickness and sub-ice morphology of glaciers. This tool is equivalent to X-rays for the medical profession and the physicists.

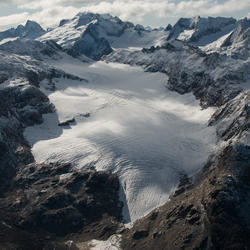
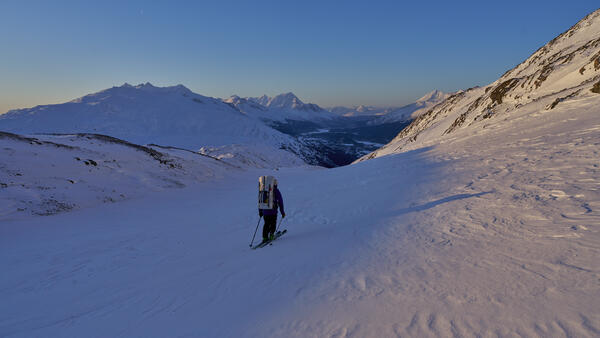
A researcher gazes across Wolverine Glacier and the surrounding snow-covered mountains
A researcher gazes across Wolverine Glacier and the surrounding snow-covered mountainsA researcher gazes across Wolverine Glacier and the surrounding snow-covered mountains during an early spring visit to collect mass balance data.

Wolverine Glacier weather station on the Kenai Peninsula, Alaska
Wolverine Glacier weather station on the Kenai Peninsula, AlaskaThe Wolverine Glacier weather station was installed in 1968, and at 3250 ft is the highest elevation long-term weather record on the Kenai Peninsula.
Wolverine Glacier weather station on the Kenai Peninsula, Alaska
Wolverine Glacier weather station on the Kenai Peninsula, AlaskaThe Wolverine Glacier weather station was installed in 1968, and at 3250 ft is the highest elevation long-term weather record on the Kenai Peninsula.

Upgraded Wolverine Glacier weather station, Alaska
Upgraded Wolverine Glacier weather station, AlaskaThe Wolverine Glacier weather station was installed in 1968, and at 3250 ft is the highest elevation long-term weather record on the Kenai Peninsula. In Ocotober 2020, USGS scientists upgraded the power system to a Lithium battery bank and installed a radar-based precipitation sensor (Lufft WS-100) to compare with the weighing based precipitation gage. The

View South from Wolverine Glacier
View South from Wolverine Glacier

Ablation Stake on Wolverine Glacier
An ablation stake which began the summer below the surface of the snow is shown here in the fall, extending far above bare ice surface of Wolverine Glacier, Alaska. A USGS scientist carries a portable steam drill, used to install the stakes in the glacier.
An ablation stake which began the summer below the surface of the snow is shown here in the fall, extending far above bare ice surface of Wolverine Glacier, Alaska. A USGS scientist carries a portable steam drill, used to install the stakes in the glacier.

View from Wolverine Glacier from Helicopter
View from Wolverine Glacier from Helicopter

A windblown stand of hemlock trees at the Wolverine Glacier field site
A windblown stand of hemlock trees at the Wolverine Glacier field siteA windblown stand of hemlock trees at the Wolverine Glacier field site
A windblown stand of hemlock trees at the Wolverine Glacier field site
A windblown stand of hemlock trees at the Wolverine Glacier field siteA windblown stand of hemlock trees at the Wolverine Glacier field site

Ice core extracted from Wolverine Glacier, Alaska
USGS scientist, Chris McNeil, measures and weighs an ice core extracted from Wolverine Glacier to determine the density of the firn layer.
USGS scientist, Chris McNeil, measures and weighs an ice core extracted from Wolverine Glacier to determine the density of the firn layer.

Scientists use ground penetrating radar on Wolverine Glacier, AK
Scientists use ground penetrating radar on Wolverine Glacier, AKResearchers use ground penetrating radar to determine the depth of the snow on Wolverine Glacier. Wolverine Glacier is in the Kenai Mountains on the coast of south-central Alaska. In 1966 scientists with the USGS began making direct measurements of surface mass balance at Wolverine Glacier, one of the "benchmark glaciers" in Alaska.

Wolverine Glacier
A researcher locates an ablation stake near a crevasse on Wolverine Glacier. These collapsible poles are used to measure snow and ice melt on the glacier surface.
A researcher locates an ablation stake near a crevasse on Wolverine Glacier. These collapsible poles are used to measure snow and ice melt on the glacier surface.

Collecting data at an ablation stake on Wolverine Glacier
Collecting data at an ablation stake on Wolverine GlacierUSGS scientist, Chris McNeil, collects data at an ablation stake on Wolverine Glacier near the end of the glacial melt season.
Collecting data at an ablation stake on Wolverine Glacier
Collecting data at an ablation stake on Wolverine GlacierUSGS scientist, Chris McNeil, collects data at an ablation stake on Wolverine Glacier near the end of the glacial melt season.

A scientist dumps DNA tracer into a moulin on Wolverine Glacier
A scientist dumps DNA tracer into a moulin on Wolverine GlacierA scientist dumps DNA tracer into a moulin on Wolverine Glacier to assess water flow through the glacier as part of research aimed at understanding glacier processes.
A scientist dumps DNA tracer into a moulin on Wolverine Glacier
A scientist dumps DNA tracer into a moulin on Wolverine GlacierA scientist dumps DNA tracer into a moulin on Wolverine Glacier to assess water flow through the glacier as part of research aimed at understanding glacier processes.
Wolverine Glacier is located in the high-latitude maritime climate regime of Alaska’s Kenai Mountains. Glacier observations began at this site in 1966.
Return to Glaciers and Landscape Change
Media
Sources/Usage: Public Domain. View Media Details
Wolverine Glacier is in the Kenai Mountains on the coast of south-central Alaska. The climate is maritime, characterized by low temperature variability and heavy, regular precipitation. Wolverine Glacier has a southerly aspect, with a narrow terminus at 450 m and a broad head up to 1680 m. In 2018 the Glacier was approximately 7 km long, and encompassed an area of 15.6 km2 in its 24.5 km2 basin (O'Neel et al, 2019).
In 1966 scientists with the USGS began making direct measurements of surface mass balance at Wolverine Glacier, one of two "benchmark glaciers" in Alaska. Repeated measurements at three long-term "index" sites, in conjunction with local meteorology and runoff data, are used to estimate glacier-wide mass balances. These data constitute the longest continuous set of mass-balance data in North America (Josberger and others, 2007) which are used to understand glacier dynamics and hydrology, and to understand the glacier's response to climate change.
Research
Media
Sources/Usage: Public Domain. View Media Details
Glacier mass balance
In 1966 the U.S. Geological Survey began direct measurements of surface mass balance at Wolverine Glacier (Mayo et al, 2003). After a decade of dense spatial sampling the measurements were reduced to three "index" sites distributed across the elevation range of the Glacier. Field visits to measure and maintain stakes at the three index sites are made each spring, at the onset of the melt season, and again in early autumn, near its completion. Density of the material gained or lost is measured with a snow-pit or core. By collecting data near the balance maxima and minima direct measurements closely reflect maximum winter snow accumulation and the annual balances at each location. Since 1975 both the stakes and the glacier surface elevations at the actual index sites have been surveyed to allow calculations of velocity and surface elevation change.
Direct field measurements are combined with weather data and imagery analyses to calculate the seasonal and annual mass balance of each glacier. Access all the data here.
Meteorologic
Meteorological observations began in 1967 with installation of temperature and precipitation instruments. Today the stations are telemetered, and near real-time values of temperature (with both passive and actively ventilated shields), relative humidity, year-round precipitation (with known compromises in measuring snow), wind speed and direction, and solar radiation are publicly available. Recent changes to the program include installing modern precipitation gauges (Sutron) and installing new stations to directly measure lapse rates in each basin.
Media
Sources/Usage: Public Domain. View Media Details
Current data available from the Wolverine weather station (USGS 15236895) includes:
- Temperature, air
- Wind speed
- Wind direction
- Cumulative Precipitation
Instrument Site and Climate Description
The Wolverine weather station (60°23' N, 148°55' W) is located at an altitude of 990 meters (m) on a tundra knoll along the western boundary of the basin. The station is slightly lower than the glacier's average equilibrium line altitude and approximately 500 m from the west edge of the glacier. The average annual air temperature at the recorder site is about -1.0 degree Celsius(°C), and the average annual precipitation-gage catch is about 1,100 millimeters (mm) (recorded annual precipitation catch represents approximately 33 percent of actual annual basin precipitation due to the low catch efficiency for snowfall). Snowfall is the dominant form of precipitation and usually accumulates on the glacier from September through mid-June. Daily average temperatures range from a low of -25°C to a high of 15°C. Daily precipitation catch can be over 110 mm.
The original weather station had analogue instruments with strip-chart recorders. Daily average temperatures from that era have an accuracy of about ±1.0°C (Mayo, March, and Trabant, 1992; Kennedy, 1995). Daily precipitation records are complicated by thermal expansion of the antifreeze water solution. The annual precipitation record represents approximately 33 percent of actual annual basin precipitation due to limited catch efficiency during snowfall (Mayo and others, 1992). Starting in the late 1980's the station has been updated with progressively newer, more accurate, and more sensors.
Ridge-Top climate station
An additional weather station was installed at higher elevation in 2012. The ridge-top weather station (60°24' N, 148°57' W) is ~1 km west of the glacier at 1420 m. Measurements at this site include:
- Temperature (daily values available online)
- Relative Humidity
- Wind Speed
- Wind Direction
- Radiation (incoming & outgoing, shortwave & longwave)
Hydrologic
Media
Sources/Usage: Public Domain. View Media Details
The "Wolverine Creek near Lawing" stream-gaging station, USGS station 15236900, is part of the USGS network of nearly 100 stations in Alaska. Data collection and analysis are conducted by standard techniques developed by the USGS. Daily values of discharge are available online and reported in annual publications of the USGS Water-Data Report series.
Wolverine gaging station (USGS 15236900):
- Temperature, air
- Precipitation
- Stream Discharge
- Gage height
Location: Latitude 60°22'14"N., Longitude 148°53'48"W., 370 m altitude, in NE 1/4 sec.10, T.3 N., R.3 E., Hydrologic Unit 19020202, on left bank about 0.15 km downstream from terminus of Wolverine Glacier and 25 km east of Lawing, Alaska.
Drainage area: 24.5 km2
Period of record: October 1966 to September 1978, October 1980 to September 1981, May 1997 to September 1997, October 2000 to current.
NOTE: Records are poor. The creek bed is composed of poorly-sorted gravel and small boulders. The channel is subject to frequent changes during high flows. Large fluctuations from ice melt and alternative damming and storage release during the melt season.
Typical summer mean daily discharge is about 9 m3/s; the period-of-record instantaneous peak discharge was 51 m3/s on August 21, 1981 (Benson and others, 1998).
Previous Work
Measurements began on Wolverine Glacier in 1966 resulting in many reports and analysis among other benchmark glaciers. Detailed results from 1966 and 1967 are reported by Meier and others (1971) and Tangborn and others (1977), respectively. Ice and water balances for 1965/66 hydrologic years are reported by Meier et al. (1971). Measured winter snow balances and annual balances from 1966-77 are reported by Meier and others (1980).
Media
Sources/Usage: Public Domain. View Media Details
Since 1966, part of the Wolverine data set (net balance, accumulation, ablation, accumulation area ratio (AAR), and equilibrium line altitude (ELA)) has been published by the World Glacier Monitoring Service (Kasser, 1967; Muller, 1977; Haeberli, 1985; Haeberli and Müller, 1988; Haeberli and Hoelzle, 1993). Air temperature and precipitation data for 1967-1988 were published by Mayo, March and Trabant (1992) and summarized by Mayo and March (1990) and for 1994 by March (1998).
Regional Impacts
Wolverine Glacier is located in the Kenai Mountains of Alaska, 65 miles south of Anchorage. The glacier is located in a maritime climate, within the Nellie Juan river basin. Runoff drains into the Nellie Juan Fjord of Prince William Sound, approximately 9 miles east of the current glacier terminus. Glaciers in in the Gulf of Alaska influence the nearshore marine environment by providing a seasonal pulse of cold, sediment-rich freshwater, impacting coastal ecology and ocean currents. Changes in coastal Alaskan glaciers will have profound impacts on downstream areas, including river and fjord ecology, and nearshore ocean currents.
Selected Publications:
Beamer, J.P., D.F. Hill, D. McGrath, A. Arendt, and C. Kienholz, 2017, Hydrologic impacts of changes in climate and glacier extent in the Gulf of Alaska watershed, Water Resour. Res., 53, 7502–7520, doi:10.1002/2016WR020033.
O'Neel, S., et al., 2015, Icefield-to-ocean linkages across the Northern Pacific coastal temperate rainforest ecosystem, BioScience, 65, 499– 512, doi:10.1093/biosci/biv027.
Glaciers and Landscape Change
Mountain glaciers are dynamic reservoirs of frozen water, deeply interconnected with their surrounding ecosystems. Glacier change in North America has major societal impacts, including to water resources, natural hazard risk, tourism disruption, fisheries, and global sea level change. Understanding and quantifying precise connections between changing glaciers, the surrounding landscape and climate...
2025 USGS Benchmark Glaciers Executive Summary
2025 Data Now Available: Explore how the USGS Benchmark Glaciers have changed in 2025
Mass Balance Methods: Measuring Glacier Change
Nearly all of Earth's alpine glaciers are losing mass, with consequences for freshwater resources, landscape stability, regional ecosystems, and global sea level. Rates of glacier mass loss in Western North America and Alaska are among the highest on Earth (The GlaMBIE Team, 2025).
Additional Research Glaciers
The USGS Glacier Project has conducted research beyond the Benchmark Glaciers, both past and present. This work has focused on infrastructure hazards, rapid glacier change, landscape destabilization, and glacier dynamics and processes not captured by the Benchmark Glacier network. These glaciers include Black Rapids, Kahiltna, Kennicott, Columbia, Hubbard, and Taku.
Gulkana Glacier
Gulkana Glacier is located in the high-latitude continental climate regime of Alaska’s Delta Mountains. Glacier observations began at this site in 1966 and continue through present as the northern most USGS Benchmark Glacier.
Lemon Creek Glacier
Lemon Creek Glacier is located in the high-latitude maritime region of Alaska, at the southernmost tip of the Juneau Icefield. Glacier observations began at this site in 1953.
South Cascade Glacier
South Cascade Glacier is located in the midlatitude maritime climate of the North Cascade Mountains of Washington State. Glacier observations began at this site in 1958.
Sperry Glacier
Sperry Glacier is located along the Continental Divide within Glacier National Park, Montana. It represents the midlatitude continental or transitional climate. Glacier observations began at this site in 2005.
Wolverine Glacier Ecosystem Studies
This project is an extension of the long-term Wolverine Glacier Benchmark Glacier project and is improving our understanding of solutes and nutrients in glacier basins, and how they fuel downstream ecosystems.
Filter Total Items: 25
Zan Frederick (USGS) on upper Wolverine Glacier
Wind driven snow transport across the glacier surface near site Y on upper Wolverine Glacier.
Wind driven snow transport across the glacier surface near site Y on upper Wolverine Glacier.
Zan Frederick (USGS) extending a mass balance stake
Zan Frederick (USGS) extending a mass balance stakeExtending a mass balance stake at site EC on upper wolverine glacier. These stakes are used to measure snow accumulation and ablation (melt).
Zan Frederick (USGS) extending a mass balance stake
Zan Frederick (USGS) extending a mass balance stakeExtending a mass balance stake at site EC on upper wolverine glacier. These stakes are used to measure snow accumulation and ablation (melt).
Zan Frederick (USGS) taking notes on Wolverine Glacier
Zan Frederick (USGS) taking notes on Wolverine GlacierTaking notes at site EC on Wolverine Glacier.
Zan Frederick (USGS) digging a snowpit
At site S on Wolverine Glacier. Zan digs down to the previous summer surface to see where the ablation stake intersects the melt surface. This will allow scientists to calculate the ablation (melt) from the previous summer.
At site S on Wolverine Glacier. Zan digs down to the previous summer surface to see where the ablation stake intersects the melt surface. This will allow scientists to calculate the ablation (melt) from the previous summer.
Zan Frederick (USGS) packing gear at sunset on Wolverine Glacier
Zan Frederick (USGS) packing gear at sunset on Wolverine GlacierBy 4:42 pm on December 13, the sun has set and it is time leave Wolverine Glacier.
Zan Frederick (USGS) packing gear at sunset on Wolverine Glacier
Zan Frederick (USGS) packing gear at sunset on Wolverine GlacierBy 4:42 pm on December 13, the sun has set and it is time leave Wolverine Glacier.
Zan Frederick (USGS) skiing down Wolverine Glacier to Paradise Lake
Zan Frederick (USGS) skiing down Wolverine Glacier to Paradise LakeThe wind was too strong for a helicopter to land, therefore, glaciologist skied down Wolverine Glacier to Paradise Lake.
Zan Frederick (USGS) skiing down Wolverine Glacier to Paradise Lake
Zan Frederick (USGS) skiing down Wolverine Glacier to Paradise LakeThe wind was too strong for a helicopter to land, therefore, glaciologist skied down Wolverine Glacier to Paradise Lake.
Timelapse imagery from Wolverine Glacier, Alaska (2012 - 2022)
Timelapse imagery from Wolverine Glacier, Alaska (2012 - 2022)The timelapse imagery provided here shows the lower half of Wolverine Glacier from 2012 to 2022. This imagery gives an intuitive view of the scale of change happening at glaciers across Alaska.
Sun setting on weather station at Wolverine Glacier
Sun setting on weather station at Wolverine GlacierRemote weather stations, like this one at Wolverine Glacier, collect data near each glacier so scientists can understand regional climate influence on the glaciers.
Sun setting on weather station at Wolverine Glacier
Sun setting on weather station at Wolverine GlacierRemote weather stations, like this one at Wolverine Glacier, collect data near each glacier so scientists can understand regional climate influence on the glaciers.
Scientist with data notebook
Scientist uses radio-echo-sounding to study firn compaction on Wolverine Glacier, Alaska. Radio-echo sounding (RES) is a technique used by glaciologists to measure the internal structure, ice thickness and sub-ice morphology of glaciers. This tool is equivalent to X-rays for the medical profession and the physicists.
Scientist uses radio-echo-sounding to study firn compaction on Wolverine Glacier, Alaska. Radio-echo sounding (RES) is a technique used by glaciologists to measure the internal structure, ice thickness and sub-ice morphology of glaciers. This tool is equivalent to X-rays for the medical profession and the physicists.
A researcher gazes across Wolverine Glacier and the surrounding snow-covered mountains
A researcher gazes across Wolverine Glacier and the surrounding snow-covered mountainsA researcher gazes across Wolverine Glacier and the surrounding snow-covered mountains during an early spring visit to collect mass balance data.
Wolverine Glacier weather station on the Kenai Peninsula, Alaska
Wolverine Glacier weather station on the Kenai Peninsula, AlaskaThe Wolverine Glacier weather station was installed in 1968, and at 3250 ft is the highest elevation long-term weather record on the Kenai Peninsula.
Wolverine Glacier weather station on the Kenai Peninsula, Alaska
Wolverine Glacier weather station on the Kenai Peninsula, AlaskaThe Wolverine Glacier weather station was installed in 1968, and at 3250 ft is the highest elevation long-term weather record on the Kenai Peninsula.
Upgraded Wolverine Glacier weather station, Alaska
Upgraded Wolverine Glacier weather station, AlaskaThe Wolverine Glacier weather station was installed in 1968, and at 3250 ft is the highest elevation long-term weather record on the Kenai Peninsula. In Ocotober 2020, USGS scientists upgraded the power system to a Lithium battery bank and installed a radar-based precipitation sensor (Lufft WS-100) to compare with the weighing based precipitation gage. The
View South from Wolverine Glacier
View South from Wolverine Glacier
Ablation Stake on Wolverine Glacier
An ablation stake which began the summer below the surface of the snow is shown here in the fall, extending far above bare ice surface of Wolverine Glacier, Alaska. A USGS scientist carries a portable steam drill, used to install the stakes in the glacier.
An ablation stake which began the summer below the surface of the snow is shown here in the fall, extending far above bare ice surface of Wolverine Glacier, Alaska. A USGS scientist carries a portable steam drill, used to install the stakes in the glacier.
View from Wolverine Glacier from Helicopter
View from Wolverine Glacier from Helicopter
A windblown stand of hemlock trees at the Wolverine Glacier field site
A windblown stand of hemlock trees at the Wolverine Glacier field siteA windblown stand of hemlock trees at the Wolverine Glacier field site
A windblown stand of hemlock trees at the Wolverine Glacier field site
A windblown stand of hemlock trees at the Wolverine Glacier field siteA windblown stand of hemlock trees at the Wolverine Glacier field site
Ice core extracted from Wolverine Glacier, Alaska
USGS scientist, Chris McNeil, measures and weighs an ice core extracted from Wolverine Glacier to determine the density of the firn layer.
USGS scientist, Chris McNeil, measures and weighs an ice core extracted from Wolverine Glacier to determine the density of the firn layer.
Scientists use ground penetrating radar on Wolverine Glacier, AK
Scientists use ground penetrating radar on Wolverine Glacier, AKResearchers use ground penetrating radar to determine the depth of the snow on Wolverine Glacier. Wolverine Glacier is in the Kenai Mountains on the coast of south-central Alaska. In 1966 scientists with the USGS began making direct measurements of surface mass balance at Wolverine Glacier, one of the "benchmark glaciers" in Alaska.
Wolverine Glacier
A researcher locates an ablation stake near a crevasse on Wolverine Glacier. These collapsible poles are used to measure snow and ice melt on the glacier surface.
A researcher locates an ablation stake near a crevasse on Wolverine Glacier. These collapsible poles are used to measure snow and ice melt on the glacier surface.
Collecting data at an ablation stake on Wolverine Glacier
Collecting data at an ablation stake on Wolverine GlacierUSGS scientist, Chris McNeil, collects data at an ablation stake on Wolverine Glacier near the end of the glacial melt season.
Collecting data at an ablation stake on Wolverine Glacier
Collecting data at an ablation stake on Wolverine GlacierUSGS scientist, Chris McNeil, collects data at an ablation stake on Wolverine Glacier near the end of the glacial melt season.
A scientist dumps DNA tracer into a moulin on Wolverine Glacier
A scientist dumps DNA tracer into a moulin on Wolverine GlacierA scientist dumps DNA tracer into a moulin on Wolverine Glacier to assess water flow through the glacier as part of research aimed at understanding glacier processes.
A scientist dumps DNA tracer into a moulin on Wolverine Glacier
A scientist dumps DNA tracer into a moulin on Wolverine GlacierA scientist dumps DNA tracer into a moulin on Wolverine Glacier to assess water flow through the glacier as part of research aimed at understanding glacier processes.