
Low dunes on Cape Canaveral often overwash during storm events, transporting sand landward. Critical infrastructure may be buried or flooded. In addition, significant landward transport of sand may lead to extensive shoreline erosion.
Images
Coastal and Marine Hazards and Resources Program images.
Filter Total Items: 2415

View along the railroad tracks on Cape Canaveral
Low dunes on Cape Canaveral often overwash during storm events, transporting sand landward. Critical infrastructure may be buried or flooded. In addition, significant landward transport of sand may lead to extensive shoreline erosion.

Photo showing turtle tracks on a dune at Cape Canaveral
Photo showing turtle tracks on a dune at Cape CanaveralPhoto showing turtle tracks leading from a nest on a dune at Cape Canaveral.
Photo showing turtle tracks on a dune at Cape Canaveral
Photo showing turtle tracks on a dune at Cape CanaveralPhoto showing turtle tracks leading from a nest on a dune at Cape Canaveral.

Oblique photos of Cape Cod coast
2009 oblique photos of Cape Cod Bay from a USGS overflight
2009 oblique photos of Cape Cod Bay from a USGS overflight

Cape Cod Bay oblique photos from a USGS overflight
Cape Cod Bay oblique photos from a USGS overflight2009 oblique photos of Cape Cod Bay from a USGS overflight
Cape Cod Bay oblique photos from a USGS overflight
Cape Cod Bay oblique photos from a USGS overflight2009 oblique photos of Cape Cod Bay from a USGS overflight

Kelp Greenling in Half Moon Bay
Kelp greenling fish, about 8 inches long, swims above a seafloor of mixed gravel, cobble, and rock near Half Moon Bay, California.
Kelp greenling fish, about 8 inches long, swims above a seafloor of mixed gravel, cobble, and rock near Half Moon Bay, California.

Tripod deployment along the outer perimeter of Diamond Shoals, NC
Tripod deployment along the outer perimeter of Diamond Shoals, NCMarinna Martini, Woods Hole, Coastal and Marine Science Center, prepares to deploy tripods at three sites along the outer perimeter of Diamond Shoals, North Carolina.
Tripod deployment along the outer perimeter of Diamond Shoals, NC
Tripod deployment along the outer perimeter of Diamond Shoals, NCMarinna Martini, Woods Hole, Coastal and Marine Science Center, prepares to deploy tripods at three sites along the outer perimeter of Diamond Shoals, North Carolina.

Deploying an instrumented minipod South of Fire Island, NY.
Deploying an instrumented minipod South of Fire Island, NY.USGS researchers deploying an instrumented minipod South of Fire Island, NY.
Deploying an instrumented minipod South of Fire Island, NY.
Deploying an instrumented minipod South of Fire Island, NY.USGS researchers deploying an instrumented minipod South of Fire Island, NY.

Shaded relief and combined bathymetry map of Puerto Rico
Shaded relief and combined bathymetry map of Puerto Rico(Top image) Shaded relief of the new multibeam bathymetry along the Puerto Rico Trench illuminated from the northwest. Thin contours indicate bathymetry at 500-m intervals. (Bottom image) Combined bathymetry map of the multibeam bathymetry data, single-beam bathymetry compilation around Puerto Rico, Lidar data near shore, and topography of Puerto Rico.

Remote places
Woods Hole Coastal and Marine Science Center's Ellyn Montgomery (right) on the helipad of the Canadian Coast Guard Vessel Louis St. Laurent returning from an ice reconnaissance flight as part of a joint study mapping the foot of the continental slope in the Arctic Ocean in 2008
Woods Hole Coastal and Marine Science Center's Ellyn Montgomery (right) on the helipad of the Canadian Coast Guard Vessel Louis St. Laurent returning from an ice reconnaissance flight as part of a joint study mapping the foot of the continental slope in the Arctic Ocean in 2008

Kristen Hart releasing a satellite-tagged hawksbill sea turtle
Kristen Hart releasing a satellite-tagged hawksbill sea turtleKristen Hart releasing a satellite-tagged hawksbill sea turtle, August 2008, Dry Tortugas National Park.
Kristen Hart releasing a satellite-tagged hawksbill sea turtle
Kristen Hart releasing a satellite-tagged hawksbill sea turtleKristen Hart releasing a satellite-tagged hawksbill sea turtle, August 2008, Dry Tortugas National Park.

Gas Hydrates Project personnel location map.
The USGS Gas Hydrates Project integrates across USGS mission areas, programs, and regions. The stars indicate the locations of personnel involved in the Gas Hydrates Project. Within the US, much of the research focuses on the Gulf of America and Alaska, which represent marine and permafrost-associated settings for gas hydrates, respectively.
The USGS Gas Hydrates Project integrates across USGS mission areas, programs, and regions. The stars indicate the locations of personnel involved in the Gas Hydrates Project. Within the US, much of the research focuses on the Gulf of America and Alaska, which represent marine and permafrost-associated settings for gas hydrates, respectively.

Static stress change models
Static stress change models for known or hypothesized faults in the Hispaniola and Puerto Rico subduction segments due to (a) slip on a patch of the Puerto Rico subduction zone, and (b) slip on a patch of the Hispaniola subduction zone. An open arrow denotes slip direction and the patches are marked by dashed rectangles.
Static stress change models for known or hypothesized faults in the Hispaniola and Puerto Rico subduction segments due to (a) slip on a patch of the Puerto Rico subduction zone, and (b) slip on a patch of the Hispaniola subduction zone. An open arrow denotes slip direction and the patches are marked by dashed rectangles.

Grand Canyon sand
Grand Canyon sand was photographed with a hand-held point-and-shoot camera in a waterproof housing.
Grand Canyon sand was photographed with a hand-held point-and-shoot camera in a waterproof housing.

Northern Alaska and potential gas hydrate occurences
Northern Alaska and potential gas hydrate occurences

Instrumented Pressure Testing Chamber
A pressurized, stable, hydrate-bearing sediment core can be fed through the IPTC body, shown here being used in Singapore to support the Indian National Gas Hydrates Program (NGHP1)
A pressurized, stable, hydrate-bearing sediment core can be fed through the IPTC body, shown here being used in Singapore to support the Indian National Gas Hydrates Program (NGHP1)
Installing oceanographic monitoring instrumentation on the seafloor
Installing oceanographic monitoring instrumentation on the seafloorUSGS research geologist Curt Storlazzi installs an instrument package on the seafloor of Maunalua Bay, Oʻahu. The platform, called a MiniPROBE, hosts six upward-looking acoustic Doppler current profilers (ADCP), seven conductivity and temperature (CT) sensors, and eight self-logging optical backscatter sensors (SLOBS).

USGS staff collecting vibracore on Ft. DeSoto Beach, Florida
USGS staff collecting vibracore on Ft. DeSoto Beach, FloridaUSGS staff collecting a sediment core on Ft. Desoto Beach, Florida using vibracoring equipment. This type of sediment coring uses the vibration of an electric motor to sink an aluminum core barrel into the ground. When the core barrel enters the ground the sediment in the ground fills up the barrel and the crew uses the tripod to pull the core out of the ground.

Deploying the poking eyeball
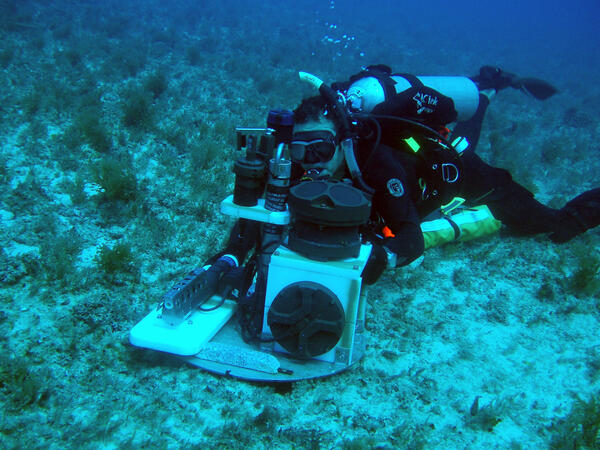
USGS scientists from the Pacific Coastal and Marine Science Center (PCMSC) in Santa Cruz, California deploy an instrument called the poking eyeball. The system, developed by PCMSC, was designed to take repetitive microscopic images of the seabed from a tripod on the seafloor.
USGS scientists from the Pacific Coastal and Marine Science Center (PCMSC) in Santa Cruz, California deploy an instrument called the poking eyeball. The system, developed by PCMSC, was designed to take repetitive microscopic images of the seabed from a tripod on the seafloor.

Arctic Ocean Extended Continental Shelf Surveys 2008-2011
Arctic Ocean Extended Continental Shelf Surveys 2008-2011Helicopter on the deck of a Canadian coast guard ice breaker ship in the Arctic Ocean.
Arctic Ocean Extended Continental Shelf Surveys 2008-2011
Arctic Ocean Extended Continental Shelf Surveys 2008-2011Helicopter on the deck of a Canadian coast guard ice breaker ship in the Arctic Ocean.

Flooding on Texas coast after Hurricane Ike passes
Flooding on Texas coast after Hurricane Ike passesFlooded coastal streets, houses, and fields after Hurricane Ike passes through Texas
Flooding on Texas coast after Hurricane Ike passes
Flooding on Texas coast after Hurricane Ike passesFlooded coastal streets, houses, and fields after Hurricane Ike passes through Texas

Protected Species Observer aboard CCGS Louis S. St-Laurent
Protected Species Observer aboard CCGS Louis S. St-LaurentProtected Species Observer aboard CCGS Louis S. St-Laurent
Protected Species Observer aboard CCGS Louis S. St-Laurent
Protected Species Observer aboard CCGS Louis S. St-LaurentProtected Species Observer aboard CCGS Louis S. St-Laurent