
Swath bathymetry and derivative products such as slope, hillshaded relief, and rugosity maps provide information not only on water depth, but also the roughness and smoothness of the sea floor, which correlates with sea floor texture and depositional environment.
Images
Coastal and Marine Hazards and Resources Program images.
Filter Total Items: 2420

Swath Bathymetry
Swath bathymetry and derivative products such as slope, hillshaded relief, and rugosity maps provide information not only on water depth, but also the roughness and smoothness of the sea floor, which correlates with sea floor texture and depositional environment.

Data input heirarchy
Sediment texture and distribution data were mapped qualitatively in Esri ArcGIS using a hierarchical methodology. Backscatter data were the first input, followed by bathymetry, surficial geologic and shallow stratigraphic interpretations, and photograph and sample databases. DEM, digital elevation model.
Sediment texture and distribution data were mapped qualitatively in Esri ArcGIS using a hierarchical methodology. Backscatter data were the first input, followed by bathymetry, surficial geologic and shallow stratigraphic interpretations, and photograph and sample databases. DEM, digital elevation model.

Sediment Textures
Inner continental shelf sediment textures within western Massachusetts Bay classified using Barnhardt and others (1998). Bottom photographs A-D show sediment texture in select locations (photograph locations are shown as white dots on the sediment texture map).
Inner continental shelf sediment textures within western Massachusetts Bay classified using Barnhardt and others (1998). Bottom photographs A-D show sediment texture in select locations (photograph locations are shown as white dots on the sediment texture map).

Li Erikson
USGS Research Oceanographer Li Erikson collects coastal data along the Pacific coast during her Mendenhall Fellowship. Her research is focused on coastal storm modeling, storm-induced coastal flooding, erosion, and cliff failures over large geographic scales.
USGS Research Oceanographer Li Erikson collects coastal data along the Pacific coast during her Mendenhall Fellowship. Her research is focused on coastal storm modeling, storm-induced coastal flooding, erosion, and cliff failures over large geographic scales.

Collecting Bathymetric Data in San Francisco Bay
USGS scientists Patrick Barnard (left) and Jeff Hansen navigate personal watercraft equipped with GPS and echo sounders through the waters of San Francisco Bay. They are collecting bathymetric, or depth, information in order to create maps of the bottom of the Bay.
USGS scientists Patrick Barnard (left) and Jeff Hansen navigate personal watercraft equipped with GPS and echo sounders through the waters of San Francisco Bay. They are collecting bathymetric, or depth, information in order to create maps of the bottom of the Bay.

Mobile GPS unit
USGS Ocean Engineer Gerry Hatcher walks along South Jetty Beach, south of Ventura Harbor in southern California, to record beach elevations using a handheld computer and mobile GPS equipment.
USGS Ocean Engineer Gerry Hatcher walks along South Jetty Beach, south of Ventura Harbor in southern California, to record beach elevations using a handheld computer and mobile GPS equipment.

Jellyfish offshore of central California
This photograph of the seafloor off the California coast also shows jellyfish in the water column. This photograph was collected as part of the California Seafloor and Coastal Mapping Program.
This photograph of the seafloor off the California coast also shows jellyfish in the water column. This photograph was collected as part of the California Seafloor and Coastal Mapping Program.

Fish on seafloor, Offshore Northern California
A kelp greenling fish swimming above a seafloor of mixed gravel, cobble and rock outcrop with scattered shell. Fish is approx. 20 cm (8 inches) long. Image acquired 1 km (0.62 miles) offshore Half Moon Bay, California at a depth of 14 meters (46 ft). Also in the image are encrusting sponges, red algae (seaweed), and orange cup corals.
A kelp greenling fish swimming above a seafloor of mixed gravel, cobble and rock outcrop with scattered shell. Fish is approx. 20 cm (8 inches) long. Image acquired 1 km (0.62 miles) offshore Half Moon Bay, California at a depth of 14 meters (46 ft). Also in the image are encrusting sponges, red algae (seaweed), and orange cup corals.

Photo of the seafloor off San Gregorio, California
Photo of the seafloor off San Gregorio, CaliforniaBoulders and biota off San Gregorio, California, in water approximately 30 meters (100 feet) deep. Organisms include bat stars, small sea anemones, strawberry anemone, cup corals, and frilly sea cucumbers.
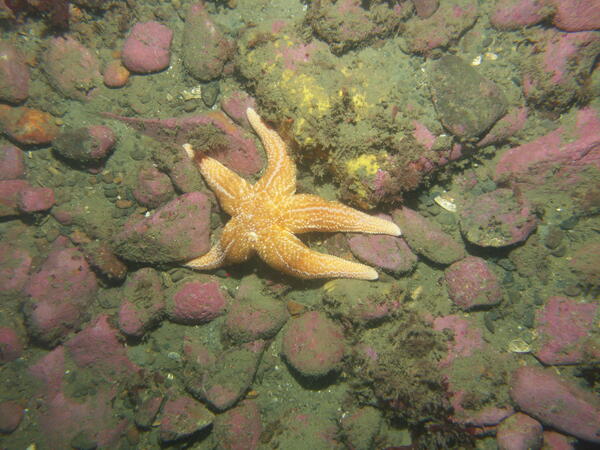
Photograph of a starfish on the sea floor, offshore of Duxbury to Hull, Massachusetts
Photograph of a starfish on the sea floor, offshore of Duxbury to Hull, MassachusettsPhotograph of a starfish on the sea floor, offshore of Duxbury to Hull, Massachusetts
Photograph of a starfish on the sea floor, offshore of Duxbury to Hull, Massachusetts
Photograph of a starfish on the sea floor, offshore of Duxbury to Hull, MassachusettsPhotograph of a starfish on the sea floor, offshore of Duxbury to Hull, Massachusetts

Eroding bluffs along Alaska’s Arctic coast
Eroding bluffs along Alaska’s Arctic coast. Note light permafrost in bluff face, below top few feet of soil and vegetation.
Eroding bluffs along Alaska’s Arctic coast. Note light permafrost in bluff face, below top few feet of soil and vegetation.

Whaling boat in Lonely, Alaska
This nearly century-old whaling boat rests along the Beaufort Sea coast near Lonely, Alaska in July, 2007. The boat was washed away to sea just a few months later.
This nearly century-old whaling boat rests along the Beaufort Sea coast near Lonely, Alaska in July, 2007. The boat was washed away to sea just a few months later.

Fire Island, NY beach houses
Beach front houses on Fire Island, NY

Suspended-sediment concentrations
Contour plots of SSC for the spatial surveys during trade-wind conditions on the reef flat. (a) SSC from the low tide survey. The highest SSC (60e70 mg/l) were located in a nearshore band, and east of the fish ponds and Kaunakakai wharf. (b) SSC from the high tide surveys.
Contour plots of SSC for the spatial surveys during trade-wind conditions on the reef flat. (a) SSC from the low tide survey. The highest SSC (60e70 mg/l) were located in a nearshore band, and east of the fish ponds and Kaunakakai wharf. (b) SSC from the high tide surveys.

Seafloor map of Puerto Rico Trench
A NOAA image of the bathymetry north of Puerto Rico. Two ancient submarine landslides are visible as head scarps (labeled Loiza and Arecibo Amphitheaters). Seafloor fissures are indicated by black arrows, and dashed lines outline debris flows from past failures. Map annotated by Uri ten Brink, USGS
A NOAA image of the bathymetry north of Puerto Rico. Two ancient submarine landslides are visible as head scarps (labeled Loiza and Arecibo Amphitheaters). Seafloor fissures are indicated by black arrows, and dashed lines outline debris flows from past failures. Map annotated by Uri ten Brink, USGS

Shaded relief image of Red Brook Harbor
Shaded relief image of Red Brook, Massachusetts Harbor
Shaded relief image of Red Brook, Massachusetts Harbor

Shaded relief image of Quicks Hole, Massachusetts
Shaded relief image of Quicks Hole, Massachusetts
Shaded relief image of Quicks Hole, Massachusetts

Multibeam bathymetry of San Francisco Bay
A multibeam bathymetric survey that produced unprecedented high resolution images of the mouth of San Francisco Bay was conducted in 2004 and 2005.
A multibeam bathymetric survey that produced unprecedented high resolution images of the mouth of San Francisco Bay was conducted in 2004 and 2005.

Didemnum vexillum
Didemnum vexillum

ATV with GPS
Jeff Hansen on an all-terrain vehicle (ATV) at Ocean Beach, San Francisco, in 2006. The ATV is equipped with instrumentation which records beach topography.
Jeff Hansen on an all-terrain vehicle (ATV) at Ocean Beach, San Francisco, in 2006. The ATV is equipped with instrumentation which records beach topography.

Starfish, seastars, blood stars
Digital still photograph from Massachusetts Bay near Cohasset, MA, showing seastars (Asterias sp.), blood stars (Henricia sanguinolenta), blood drop tunicates (Dendrodoa carnea), mussels, and barnacles on cobbles and boulders covered with bubblegum algae and red filamentous algae. Water depth at this location is approximately 19.6 meters.
Digital still photograph from Massachusetts Bay near Cohasset, MA, showing seastars (Asterias sp.), blood stars (Henricia sanguinolenta), blood drop tunicates (Dendrodoa carnea), mussels, and barnacles on cobbles and boulders covered with bubblegum algae and red filamentous algae. Water depth at this location is approximately 19.6 meters.