
Sand Island, one of the first islands on the atoll to have successfully eradicated coconut palms, which were quickly replaced by a healthy Pisonia forest with abundant shorebird life.
Images
Explore images taken during Ecosystems' Land Change Science Program fieldwork and research.
Filter Total Items: 208

Sand Island, Palmyra Atoll
Sand Island, one of the first islands on the atoll to have successfully eradicated coconut palms, which were quickly replaced by a healthy Pisonia forest with abundant shorebird life.

Western Lagoon Shoreline, Palmyra Atoll
A view of the shoreline with palm trees above bright blue water in the Western Lagoon, Palmyra Atoll.
A view of the shoreline with palm trees above bright blue water in the Western Lagoon, Palmyra Atoll.

Looking out to Sea, Palmyra Atoll
Calm, blue waters surround Palmyra Atoll. This view takes in the ocean scenery with a partial glimpse of lush green coastal vegetation on the landward side.
Calm, blue waters surround Palmyra Atoll. This view takes in the ocean scenery with a partial glimpse of lush green coastal vegetation on the landward side.

Pisonia Forest, Palmyra Atoll
Pisonia forest where coconuts have already been eradicated on Palmyra Atoll. The forest is lush and green.
Pisonia forest where coconuts have already been eradicated on Palmyra Atoll. The forest is lush and green.

North Shore of Palmyra Atoll
A view of the sandy north shore of Palmyra Atoll, with a forested edge. Recently killed coconut palm trunks poke out of the forested area.
A view of the sandy north shore of Palmyra Atoll, with a forested edge. Recently killed coconut palm trunks poke out of the forested area.

Preparing sediment samples in the lab
Physical Scientist Michelle Leung and Research Geologist Natalie Kehrwald prepare sediment samples from Santa Fe Lake, New Mexico to analyze records of interactions between past fires and human activity over the last few thousand years.
Physical Scientist Michelle Leung and Research Geologist Natalie Kehrwald prepare sediment samples from Santa Fe Lake, New Mexico to analyze records of interactions between past fires and human activity over the last few thousand years.

Dead Coconut Palms, Palmyra Atoll
A recently treated stand of coconut palms, standing and dead, which will naturally convert back to Pisonia forest, on Palmyra Atoll.
A recently treated stand of coconut palms, standing and dead, which will naturally convert back to Pisonia forest, on Palmyra Atoll.

Scenic Lagoon, Palmyra Atoll
Calm, clear and bright blue waters of a small shoreline lagoon on Palmyra Atoll.
Calm, clear and bright blue waters of a small shoreline lagoon on Palmyra Atoll.

Palm-lined Coast, Palmyra Atoll
Crystal clear, turquoise waters surrounding a palm-lined beach on Palmyra Atoll.
Crystal clear, turquoise waters surrounding a palm-lined beach on Palmyra Atoll.

Driftwood on Palmyra Atoll
Driftwood lays partially submerged in clear blue water on sandy shore of Palmyra Atoll.
Driftwood lays partially submerged in clear blue water on sandy shore of Palmyra Atoll.

Lemon Creek Glacier area change, 1948 - 2021
Lemon Creek Glacier area change, 1948 - 2021. Lemon Creek Glacier is located at the southernmost tip of the Juneau Icefield in Southeast Alaska, USA, approximately 6.5 km northeast of the city of Juneau
Lemon Creek Glacier area change, 1948 - 2021. Lemon Creek Glacier is located at the southernmost tip of the Juneau Icefield in Southeast Alaska, USA, approximately 6.5 km northeast of the city of Juneau

Wolverine Glacier area change, 1950 - 2020
Wolverine Glacier area change, 1950 - 2020. Wolverine Glacier is in the Kenai Mountains on the coast of south-central Alaska.
Wolverine Glacier area change, 1950 - 2020. Wolverine Glacier is in the Kenai Mountains on the coast of south-central Alaska.

Gulkana Glacier area change, 1957 - 2021
Gulkana Glacier area change, from 1957 - 2021. Gulkana Glacier is located along the south flank of the eastern Alaska Range.
Gulkana Glacier area change, from 1957 - 2021. Gulkana Glacier is located along the south flank of the eastern Alaska Range.

South Cascade Glacier area change, 1970 - 2021
South Cascade Glacier area change, 1970 - 2021. South Cascade Glacier located in a north-northwest facing valley near the crest of the Cascade Range in northwest Washington state.
South Cascade Glacier area change, 1970 - 2021. South Cascade Glacier located in a north-northwest facing valley near the crest of the Cascade Range in northwest Washington state.

Examining a Snow Sample
Northern Rocky Mountain Science Center scientist examines snow crystal type, layer temperature, and density to understand snowpack characteristics leading to the formation of avalanche release.
Northern Rocky Mountain Science Center scientist examines snow crystal type, layer temperature, and density to understand snowpack characteristics leading to the formation of avalanche release.

Tree Rings
The secret lives of... trees? Trees can live for hundreds and sometimes thousands of years. As they grow, they add new layers of growth – or tree rings – that scientists can study to learn about the tree’s life. The width of tree rings often reflects the factor most influencing growth from one year to the next depending upon where the tree lives.
The secret lives of... trees? Trees can live for hundreds and sometimes thousands of years. As they grow, they add new layers of growth – or tree rings – that scientists can study to learn about the tree’s life. The width of tree rings often reflects the factor most influencing growth from one year to the next depending upon where the tree lives.

Ice Cores
The cold never bothered our USGS scientists! They ask – do you want to collect an ice core?
The cold never bothered our USGS scientists! They ask – do you want to collect an ice core?

Sediment Core
Time to get our hands dirty! Paleoclimate researchers study sediment cores, which are accumulated layers of mud and dead plant material collected in a long tube, to learn about what the climate and environment of the past was like.
Time to get our hands dirty! Paleoclimate researchers study sediment cores, which are accumulated layers of mud and dead plant material collected in a long tube, to learn about what the climate and environment of the past was like.

Arctic Ostracodes with Eye Tubercles
Two species of eyed ostracodes that exhibit eye tubercles and inhabit continental shelf environments. Eye tubercles are externally visible semi-globular structures of the calcareous shell, one in each of the two valves.
Two species of eyed ostracodes that exhibit eye tubercles and inhabit continental shelf environments. Eye tubercles are externally visible semi-globular structures of the calcareous shell, one in each of the two valves.
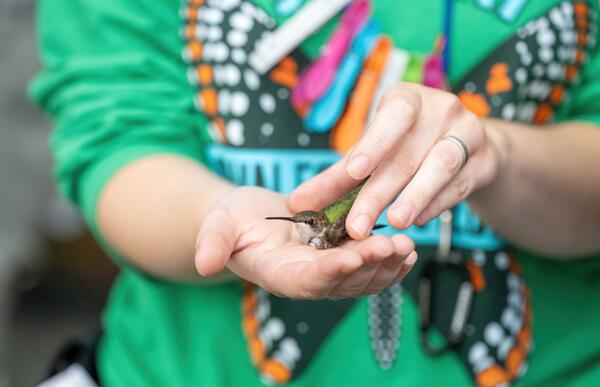
Hummingbird in the Hand
A bird biologist holds a ruby-throated hummingbird in the hand.
A bird biologist holds a ruby-throated hummingbird in the hand.

National Climate Change Viewer - High Resolution Map
National Climate Change Viewer - High Resolution MapClimate change data from the USGS National Climate Change Viewer tool is shown by US state and county for the contiguous US.
National Climate Change Viewer - High Resolution Map
National Climate Change Viewer - High Resolution MapClimate change data from the USGS National Climate Change Viewer tool is shown by US state and county for the contiguous US.