
Water Hazards
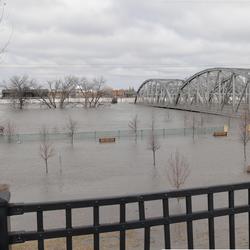
A critical application of USGS streamflow information is safeguarding communities from natural hazards.
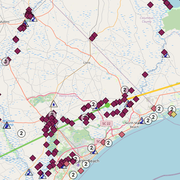
A critical application of USGS streamflow information is safeguarding communities from natural hazards. The Groundwater and Streamflow Information Program promotes the development and application of information and tools to minimize the loss of life and property due to hazards, including supporting flood forecasting, monitoring debris flows and storm surge during floods and hurricanes, and informing drought and post-fire conditions. The USGS WaterWatch website provides streamgage-based maps that highlight locations where floods and droughts are occurring. In addition to permanent streamgages, the USGS continues to expand the use of temporary Rapid Deployable Streamgages (RDGs) and storm-tide sensors, as well as enhance flood inundation mapping capabilities. The USGS Flood Event Viewer provides a one-stop application for partners and the public to view all data collected for a particular event, including real-time streamflow information and post event high-water marks. Furthermore, the USGS Floods website provides access to a range of USGS tools and datasets for current and past events. The USGS Drought website provides access to the USGS Integrated Drought Science Plan, as well as to drought-related datasets that include basic hydrologic monitoring data from the Groundwater and Streamflow Information Program.
Stakeholder Quotes
“Gaging stations are critical for being next to the river.”
Bill Bergin, Jr., Musselshell River Landowner and Musselshell Watershed Coalition [Montana] Board Member
“Many thanks…we sincerely appreciate your [USGS] support. Your data make our [river] forecasts possible.”
Kevin Low, National Weather Service, Missouri River Basin Forecast Center Hydrologist, May 25, 2018
Related
Flood Inundation Mapping (FIM) Program

USGS Integrated Drought Science Plan

Rapid Deployment Gages (RDGs)

USGS Flood Information

Surge, Wave, and Tide Hydrodynamics (SWaTH) Network
Providing Major Storm and Short-Term Flood Event Data
Related
Flood Inundation Mapping (FIM) Program
USGS Integrated Drought Science Plan
Rapid Deployment Gages (RDGs)
USGS Flood Information
Surge, Wave, and Tide Hydrodynamics (SWaTH) Network