



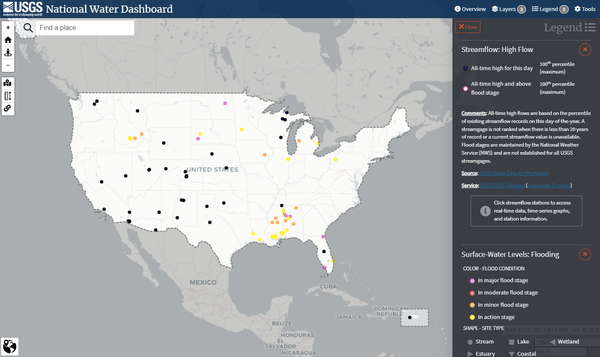
View current flooding conditions
Access streamflow, precipitation, rate of change, NWS weather and flood stage, and more in the new National Water Dashboard
Flood Event Viewer
Access information and data associated with short-term, storm-event-based collection efforts
Visualize flooding
Interactive data visualizations for flooding related to hurricanes and flood events, quarterly streamflow summaries, and more
The USGS collects real-time flood data and conducts flood science to help keep communities safe before, during, and after a flood.
Floods can occur any time of year, and high-quality flood information is essential for flood forecasting and planning, emergency response, and recovery efforts. The USGS mission to protect life and property is a critical aspect of its role in the nation. By providing reliable scientific information about natural disasters, including flooding, the USGS can help minimize the risk, loss of life, and loss of property from floods. Key activities to this mission are to anticipate, monitor, and respond to hydrologic hazards by providing reliable water data and technical expertise to partner agencies and communities across the Nation. Our flood information provides real-time situational awareness, informs flood predictions, facilitates flood impact response and assessments, supports floodplain and flood inundation mapping, guides infrastructure design and operation, helps map contaminant transport, and more.
The USGS supports these activities through data collection, publication of flood-related publications, analysis of flood exceedance probabilities and magnitudes, and development of methods to estimate floods at unmonitored locations throughout the nation. The USGS develops and deploys observational systems for identifying and tracking flood hazards, providing operational support during extreme hydrologic events, providing data for recovery, and informing community planning and hazard mitigation strategies. These efforts include:
- Operating hydrologic networks , including providing real-time water levels and stream discharge, making field measurements to ensure the accuracy and completeness of our streamflow records, collecting annual peak discharge data, and installing rapid-deployment gages to temporarily expand our observational network during large flood events.
- Supporting flood forecasting by providing the National Weather Service with real-time water conditions, which they combine with their meteorological data to forecast flood magnitude and timing.
- Collecting ephemeral flood data, including deploying temporary water and meteorological data sensors ahead of large storms, computing peak flows, and collecting and surveying high-water marks to determine peak water levels after floodwaters recede. These types of field data are vital to emergency response and recovery, but most must be collected in person during or immediately after a storm when conditions may be dangerous. Our field personnel are dedicated to collecting and relaying flood data whenever safe conditions allow.
- Documenting and analyzing flood extents and impacts, including surveying of flooded areas, creating hydraulic models, and developing flood inundation maps
- Distributing timely and reliable flood-related information through online data portals and tools, programmatic web services, direct communication, internal and interagency flood operational calls, and support from USGS hydrologic science experts.
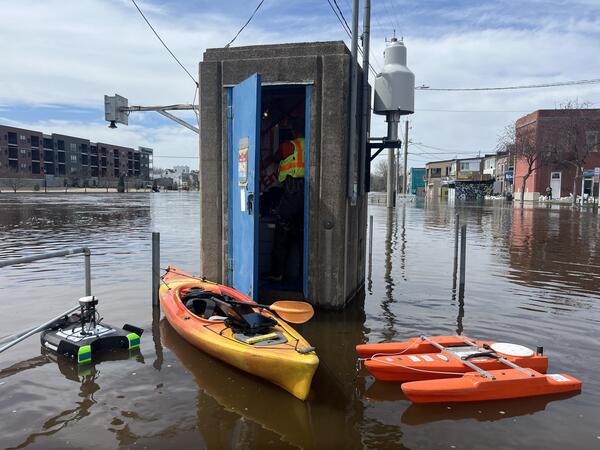
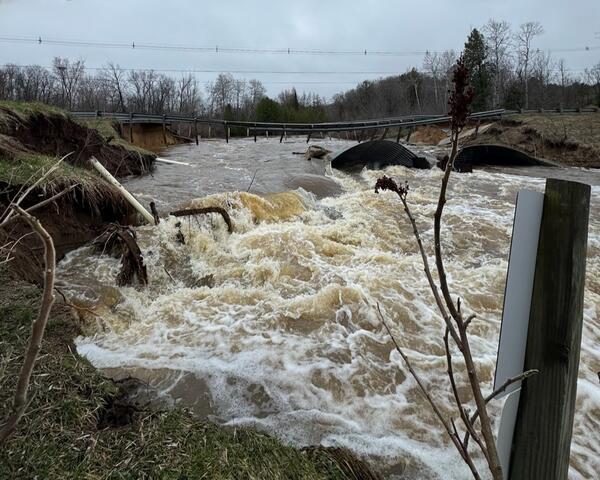
During a flood, the USGS works directly with flood response agencies like the National Weather Service (NWS), Federal Emergency Management Agency (FEMA), U.S. Army Corps of Engineers (USACE), and state and local emergency management agencies to help them access and understand USGS flood data so they can make informed decisions and protect lives and property. USGS maintains two national response coordination teams -- the inland Flood Team and the Coastal Storm Team -- that liaise with our external partners and ensure a unified and effective response to major flood events. The response coordination teams supplement USGS operations and networks to acquire additional priority flood data to meet partner needs.
Learn more about how we study floods, how we measure and map flooding, and how we support flood event response by exploring the links listed on the Science tab.
Featured Flood Products
The USGS offers multiple products to help visualize current flood conditions, estimate flood quantiles, evaluate how large floods measure up historically, and access USGS flood response activities and data, including:
- Water Data for the Nation delivery tools
- National Water Dashboard: Access current flood and high-flow conditions, along with other streamflow information.
- WaterAlert: The WaterAlert service provides notifications to your email or phone for changes in water conditions based on thresholds you choose at USGS streamgages of interest to you.
- State Pages: Access current water conditions from all monitoring locations in a state that collect continuous data records
- Explore Water Data: A dynamic tool to filter and locate monitoring locations and water data that meet customizable use cases, such as flooding comparisons.
- Hydrologic Imagery Visualization and Information System (HIVIS): View still-frame images and timelapse videos from over 1,000 active webcams.
- Real-Time Flood Impact API: Displays locations where surveyed critical safety or infrastructure features near a USGS streamgage may be currently flooded.
- Flood Event Viewer: Explore streamflow, storm tide, wave height, high-water marks, and deployed sensor data for current and historical storm events.
- Flood Inundation Mapper: Explore sets of local inundation maps that show where flooding would occur – and how deep it might be - given a selected stream condition
- StreamStats web application and web page: Explore flood statistics at USGS streamgages, plot current conditions with respect to flood statistics, and provide estimates of flood quantiles at ungaged locations.


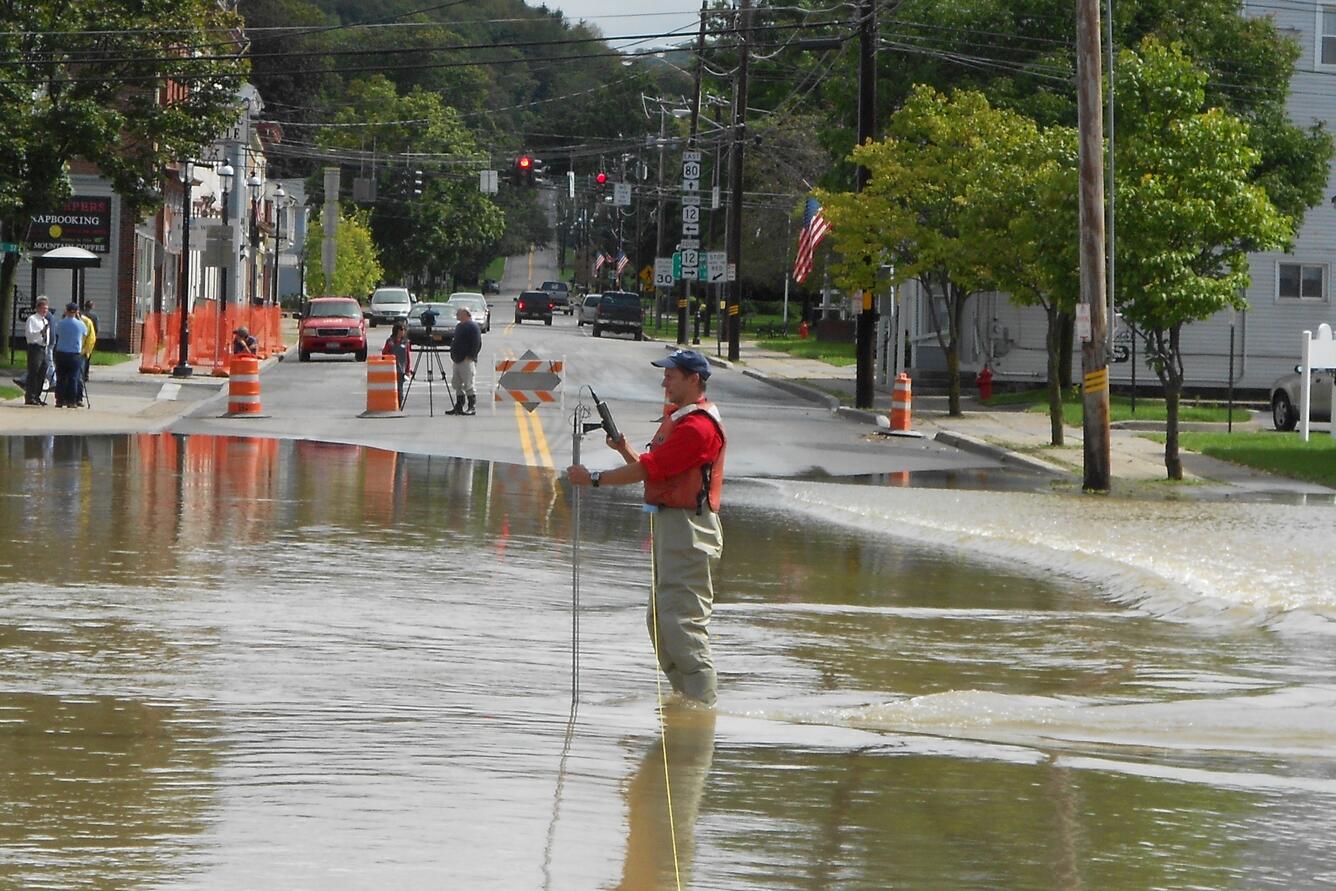


Below are other science projects associated with USGS flood information and activities.

Water Data Visualizations
Flood Inundation Mapping (FIM) Program
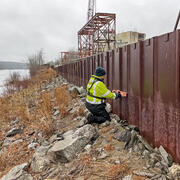
High-Water Marks

Coastal Storm Modeling System (CoSMoS)

Rapid Deployment Gages (RDGs)

StreamStats

Streamgaging Basics

Surge, Wave, and Tide Hydrodynamics (SWaTH) Network
Providing Major Storm and Short-Term Flood Event Data

Historical Flooding

Hurricanes

Floods and Recurrence Intervals
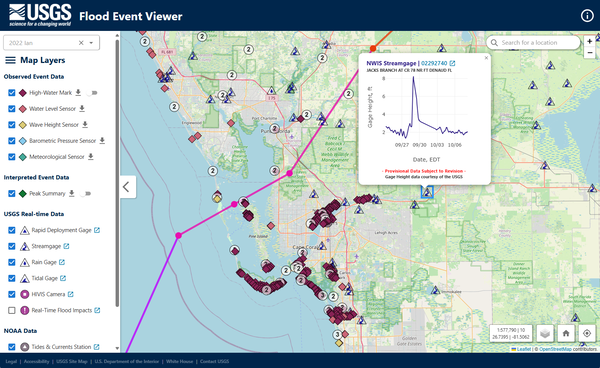
Flood Event Viewer: Hurricane Ian data collection near Fort Myers, Florida
Flood Event Viewer: Hurricane Ian data collection near Fort Myers, FloridaDuring major storms or other short-term events, the USGS collects streamflow and additional data (including storm tide, wave height, high-water marks, and additional sensor deployments) to aid in documenting flood events.
Flood Event Viewer: Hurricane Ian data collection near Fort Myers, Florida
Flood Event Viewer: Hurricane Ian data collection near Fort Myers, FloridaDuring major storms or other short-term events, the USGS collects streamflow and additional data (including storm tide, wave height, high-water marks, and additional sensor deployments) to aid in documenting flood events.
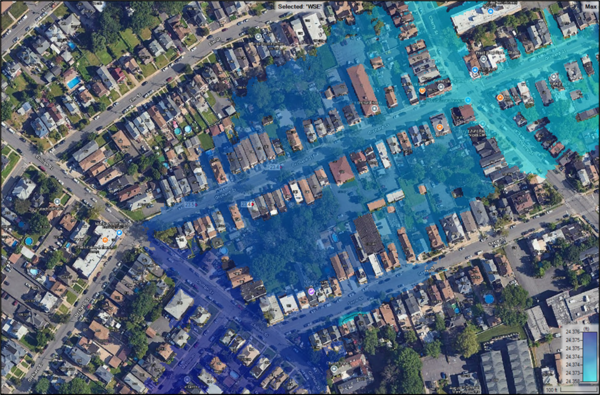
Screen capture displaying areas of inundation within the City of Elizabeth for a flood event generated from a Flood Inundation Mapper.
Screen capture displaying areas of inundation within the City of Elizabeth for a flood event generated from a Flood Inundation Mapper.
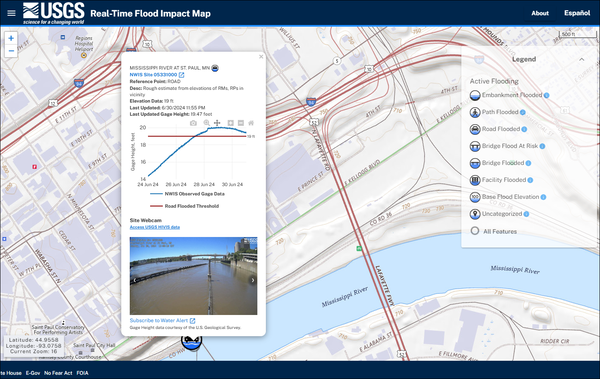
Real-Time Flood Impact Map: flooded road impact location in St. Paul, MN
Real-Time Flood Impact Map: flooded road impact location in St. Paul, MNClicking on a flood feature icon in the USGS Real-Time Flood Impact Map will display information about that Flood Impact Location, the current conditions at the nearby USGS streamgage, and the USGS HIVIS webcam image (if available). For example, this Flood Impact Location in St.
Real-Time Flood Impact Map: flooded road impact location in St. Paul, MN
Real-Time Flood Impact Map: flooded road impact location in St. Paul, MNClicking on a flood feature icon in the USGS Real-Time Flood Impact Map will display information about that Flood Impact Location, the current conditions at the nearby USGS streamgage, and the USGS HIVIS webcam image (if available). For example, this Flood Impact Location in St.
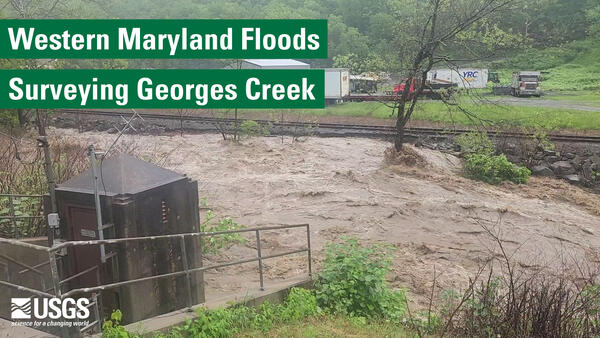
Westernport, Maryland was one of the hardest hit towns during the mid-May flooding in Western Maryland, where Georges Creek flooded an elementary school in Westernport, MD, prompting the emergency rescue of schoolchildren.
Westernport, Maryland was one of the hardest hit towns during the mid-May flooding in Western Maryland, where Georges Creek flooded an elementary school in Westernport, MD, prompting the emergency rescue of schoolchildren.
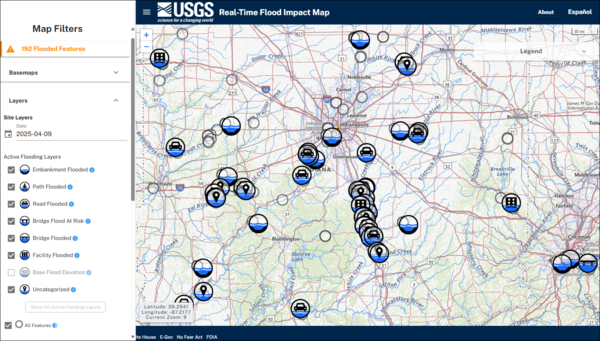
Real-Time Flood Impact Map: active flood impact locations during April 2025 flooding near Indianapolis, IN
Real-Time Flood Impact Map: active flood impact locations during April 2025 flooding near Indianapolis, INScreenshot of the USGS Real-Time Flood Impact Map on April 9, 2025, near Indianapolis, IN. Multiple streams and rivers experienced spring flooding, overtopping their embankments and affecting nearby roads, buildings, bridges, and more.
Real-Time Flood Impact Map: active flood impact locations during April 2025 flooding near Indianapolis, IN
Real-Time Flood Impact Map: active flood impact locations during April 2025 flooding near Indianapolis, INScreenshot of the USGS Real-Time Flood Impact Map on April 9, 2025, near Indianapolis, IN. Multiple streams and rivers experienced spring flooding, overtopping their embankments and affecting nearby roads, buildings, bridges, and more.

Kennebec River in downtown Augusta, Maine during flooding and normal flow
Kennebec River in downtown Augusta, Maine during flooding and normal flowKennebec River in downtown Augusta, Maine during flooding and normal flow. The left photo was taken on December 19, 2023 after a heavy rainstorm. The right photo was taken in September 2024.
Kennebec River in downtown Augusta, Maine during flooding and normal flow
Kennebec River in downtown Augusta, Maine during flooding and normal flowKennebec River in downtown Augusta, Maine during flooding and normal flow. The left photo was taken on December 19, 2023 after a heavy rainstorm. The right photo was taken in September 2024.

A cross-sectional view of a hypothetical river showing one possible arrangement of the three Federal Flood Risk Management Standard (FFRMS) floodplain elevations (Climate-Informed Science Approach, the Freeboard Value Approach, and the 0.2% Annual-Chance Flood Approach) above the current Base Flood Elevation, i.e., the 1% annual-chance flood elevation.
A cross-sectional view of a hypothetical river showing one possible arrangement of the three Federal Flood Risk Management Standard (FFRMS) floodplain elevations (Climate-Informed Science Approach, the Freeboard Value Approach, and the 0.2% Annual-Chance Flood Approach) above the current Base Flood Elevation, i.e., the 1% annual-chance flood elevation.

A cross-sectional view of a hypothetical coastline showing one possible arrangement of the three Federal Flood Risk Management Standard (FFRMS) floodplain elevations (Climate-Informed Science Approach, the Freeboard Value Approach, and the 0.2% Annual-Chance Flood Approach) above the current Base Flood Elevation, i.e., the 1% annual-chance flood elevation.
A cross-sectional view of a hypothetical coastline showing one possible arrangement of the three Federal Flood Risk Management Standard (FFRMS) floodplain elevations (Climate-Informed Science Approach, the Freeboard Value Approach, and the 0.2% Annual-Chance Flood Approach) above the current Base Flood Elevation, i.e., the 1% annual-chance flood elevation.

Measuring a High-Water Mark at the Androscoggin River in Topsham, Maine
Measuring a High-Water Mark at the Androscoggin River in Topsham, MaineA hydrologic technician measures a high-water mark near the Androscoggin River in Topsham, Maine days after a significant flood event in late December 2023. A combination of heavy rainfall and snowmelt prompted the flooding.
Measuring a High-Water Mark at the Androscoggin River in Topsham, Maine
Measuring a High-Water Mark at the Androscoggin River in Topsham, MaineA hydrologic technician measures a high-water mark near the Androscoggin River in Topsham, Maine days after a significant flood event in late December 2023. A combination of heavy rainfall and snowmelt prompted the flooding.

A high-water mark tag nailed to a tree trunk with visible debris. The debris that adheres to the tree is the physical evidence of how high the flood waters rose during the flood event; when the waters recede, the debris transported by the flood waters that was floating on the top of the water sticks to the tree.
A high-water mark tag nailed to a tree trunk with visible debris. The debris that adheres to the tree is the physical evidence of how high the flood waters rose during the flood event; when the waters recede, the debris transported by the flood waters that was floating on the top of the water sticks to the tree.

It’s an age-old question: If the river floods and no one sees it, did it flood? Yes! High water events leave behind clues such as debris that USGS scientists can observe to indirectly estimate the water level and streamflow during the event.
It’s an age-old question: If the river floods and no one sees it, did it flood? Yes! High water events leave behind clues such as debris that USGS scientists can observe to indirectly estimate the water level and streamflow during the event.

Section of Fort Myers Beach before and after Hurricane Ian
Section of Fort Myers Beach before and after Hurricane IanSection of Fort Myers Beach, Florida, before and after Hurricane Ian, 2022. The area endured severe damage and coastal change from the storm including overwashed sand, coastal flooding, and in some places, erosion.
Section of Fort Myers Beach before and after Hurricane Ian
Section of Fort Myers Beach before and after Hurricane IanSection of Fort Myers Beach, Florida, before and after Hurricane Ian, 2022. The area endured severe damage and coastal change from the storm including overwashed sand, coastal flooding, and in some places, erosion.

Landsat images from March of 2018 and March of 2019 show a stretch of the Missouri, Platte, and Elkhorn rivers in a full scene that stretches from just north of Sioux City, IA, to south of Omaha, NE. The first image shows the rivers at normal levels.
Landsat images from March of 2018 and March of 2019 show a stretch of the Missouri, Platte, and Elkhorn rivers in a full scene that stretches from just north of Sioux City, IA, to south of Omaha, NE. The first image shows the rivers at normal levels.

Hurricane Harvey flooding at Addicks Reservoir, Houston TX
Hurricane Harvey flooding at Addicks Reservoir, Houston TXAddicks Reservoir, Houston TX. Before image (8/29/2017) shows Hurricane Harvey flooding. Reservoir level was 108.8 feet at the time of the picture; the peak was 109.09 feet on 8/30. After image (4/6/2018) is eight months after the flooding; reservoir level was 69.45 ft.
Hurricane Harvey flooding at Addicks Reservoir, Houston TX
Hurricane Harvey flooding at Addicks Reservoir, Houston TXAddicks Reservoir, Houston TX. Before image (8/29/2017) shows Hurricane Harvey flooding. Reservoir level was 108.8 feet at the time of the picture; the peak was 109.09 feet on 8/30. After image (4/6/2018) is eight months after the flooding; reservoir level was 69.45 ft.

Hurricane Ida made landfall as a Category 4 hurricane in Louisiana, and brought widespread precipitation and flooding along its path and up the northeastern coast of U.S. in the following week.
Hurricane Ida made landfall as a Category 4 hurricane in Louisiana, and brought widespread precipitation and flooding along its path and up the northeastern coast of U.S. in the following week.

100-Year Flood - It's All About Chance poster image
100-Year Flood - It's All About Chance poster image

USGS measures spring flooding at Chesapeake bay's largest tributary
USGS measures spring flooding at Chesapeake bay's largest tributaryA USGS field team, to include Pat Bowen, Kate Bowen and John Trainor, uses specialized equipment to measure spring floodwaters at Chesapeake Bay's largest tributary, the Susquehanna River in Maryland.
USGS measures spring flooding at Chesapeake bay's largest tributary
USGS measures spring flooding at Chesapeake bay's largest tributaryA USGS field team, to include Pat Bowen, Kate Bowen and John Trainor, uses specialized equipment to measure spring floodwaters at Chesapeake Bay's largest tributary, the Susquehanna River in Maryland.

USGS hydrographer makes a flood measurement in Tusten, NY
USGS hydrographer makes a flood measurement in Tusten, NYUSGS hydrographer Dave Thompson makes a near-peak flood measurement off a bridge at Tenmile River in Tusten, New York.
USGS hydrographer makes a flood measurement in Tusten, NY
USGS hydrographer makes a flood measurement in Tusten, NYUSGS hydrographer Dave Thompson makes a near-peak flood measurement off a bridge at Tenmile River in Tusten, New York.

USGS hydrographer Brent Hanson wades out in freezing waters to collect flood measurements on the Sheyenne River near Cooperstown, North Dakota. Hanson reads an outside staff, which is a vertical graduated ruler used to calibrate the continuous readings of water level provided by electronic sensors.
USGS hydrographer Brent Hanson wades out in freezing waters to collect flood measurements on the Sheyenne River near Cooperstown, North Dakota. Hanson reads an outside staff, which is a vertical graduated ruler used to calibrate the continuous readings of water level provided by electronic sensors.

A frozen USGS rapid deployment streamgage measures the height of the Maple River near Page, North Dakota. RDGs can be installed on short notice to provide additional information at locations that are normally not gauged.
A frozen USGS rapid deployment streamgage measures the height of the Maple River near Page, North Dakota. RDGs can be installed on short notice to provide additional information at locations that are normally not gauged.

What are the two types of floods? What are the two types of floods?
There are two basic types of floods: flash floods and the more widespread river floods. Flash floods generally cause greater loss of life and river floods generally cause greater loss of property. A flash flood occurs when runoff from excessive rainfall causes a rapid rise in the water height (stage) of a stream or normally-dry channel. Flash floods are more common in areas with a dry climate and...

How are floods predicted? How are floods predicted?
Flood predictions require several types of data: The amount of rainfall occurring on a real-time basis. The rate of change in river stage on a real-time basis, which can help indicate the severity and immediacy of the threat. Knowledge about the type of storm producing the moisture, such as duration, intensity and areal extent, which can be valuable for determining possible severity of the...

Where can I find flood maps? Where can I find flood maps?
FEMA is the official public source for flood maps for insurance purposes: FEMA’s Flood Map Service Center FEMA’s National Flood Hazard Layer NOAA is responsible for producing flood forecast maps that combine precipitation data with USGS streamflow data: NWS - National Water Prediction Service: River forecasts and long range flood outlook Coastal Inundation Dashboard: Real-time and historical...

We had a "100-year flood" two years in a row. How can that be? We had a "100-year flood" two years in a row. How can that be?
The term "100-year flood" is used to describe the recurrence interval of floods. The 100-year recurrence interval means that a flood of that magnitude has a one percent chance of occurring in any given year. In other words, the chances that a river will flow as high as the 100-year flood stage this year is 1 in 100. Statistically, each year begins with the same 1-percent chance that a 100-year...

Does an increase in the 100-year flood estimate originate from climate or land-use change? Does an increase in the 100-year flood estimate originate from climate or land-use change?
Climate variability (dry cycles to wet cycles) and land-use change play a significant role, but there is a large amount of uncertainty around the flood quantile estimates (the value of discharge corresponding to the 100-year flood), particularly if there isn’t a long record of observed data at a stream location. Learn more: The 100-Year Flood The 100-Year Flood--It's All About Chance

How can a 1,000-year rainfall not result in a 1,000-year flood? How can a 1,000-year rainfall not result in a 1,000-year flood?
It comes down to a number of factors, including the pattern of movement of the rainstorm in each particular watershed, the conditions of the soil and plant matter in the watershed, and the timing of the rainstorm in one watershed versus other watersheds. For example, if the ground is already saturated before a rainstorm, much of the rain will run off into streams, but if the ground is dry, it will...

What is a 1,000-year flood? What is a 1,000-year flood?
The term “1,000-year flood” means that, statistically speaking, a flood of that magnitude (or greater) has a 1 in 1,000 chance of occurring in any given year. In terms of probability, the 1,000-year flood has a 0.1% chance of happening in any given year. These statistical values are based on observed data.

Why do the values for the 100-year flood seem to change with every flood? Why do the values for the 100-year flood seem to change with every flood?
The amount of water corresponding to a 100-year flood, a 500-year flood, or a 1,000-year flood is known as a "flood quantile." For instance, on a given river, the flood quantile corresponding to the 50-year flood might be 10,000 cubic feet per second (cfs) and the flood quantile corresponding to the 100-year flood might be 15,000 cfs. The estimates of the flood quantiles are calculated using...

How can I obtain river forecasts (flood forecasts)? How can I obtain river forecasts (flood forecasts)?
River forecasts (flood forecasts) are made by the National Weather Service - National Water Prediction Service. The overall map on the website uses color designations to give a quick overview of current conditions. A legend and other information can be selected in the right column. From the main map, click on a station to bring up a box which includes a graph showing current information and a...
The USGS collects real-time flood data and conducts flood science to help keep communities safe before, during, and after a flood.
Floods can occur any time of year, and high-quality flood information is essential for flood forecasting and planning, emergency response, and recovery efforts. The USGS mission to protect life and property is a critical aspect of its role in the nation. By providing reliable scientific information about natural disasters, including flooding, the USGS can help minimize the risk, loss of life, and loss of property from floods. Key activities to this mission are to anticipate, monitor, and respond to hydrologic hazards by providing reliable water data and technical expertise to partner agencies and communities across the Nation. Our flood information provides real-time situational awareness, informs flood predictions, facilitates flood impact response and assessments, supports floodplain and flood inundation mapping, guides infrastructure design and operation, helps map contaminant transport, and more.
The USGS supports these activities through data collection, publication of flood-related publications, analysis of flood exceedance probabilities and magnitudes, and development of methods to estimate floods at unmonitored locations throughout the nation. The USGS develops and deploys observational systems for identifying and tracking flood hazards, providing operational support during extreme hydrologic events, providing data for recovery, and informing community planning and hazard mitigation strategies. These efforts include:
- Operating hydrologic networks , including providing real-time water levels and stream discharge, making field measurements to ensure the accuracy and completeness of our streamflow records, collecting annual peak discharge data, and installing rapid-deployment gages to temporarily expand our observational network during large flood events.
- Supporting flood forecasting by providing the National Weather Service with real-time water conditions, which they combine with their meteorological data to forecast flood magnitude and timing.
- Collecting ephemeral flood data, including deploying temporary water and meteorological data sensors ahead of large storms, computing peak flows, and collecting and surveying high-water marks to determine peak water levels after floodwaters recede. These types of field data are vital to emergency response and recovery, but most must be collected in person during or immediately after a storm when conditions may be dangerous. Our field personnel are dedicated to collecting and relaying flood data whenever safe conditions allow.
- Documenting and analyzing flood extents and impacts, including surveying of flooded areas, creating hydraulic models, and developing flood inundation maps
- Distributing timely and reliable flood-related information through online data portals and tools, programmatic web services, direct communication, internal and interagency flood operational calls, and support from USGS hydrologic science experts.
During a flood, the USGS works directly with flood response agencies like the National Weather Service (NWS), Federal Emergency Management Agency (FEMA), U.S. Army Corps of Engineers (USACE), and state and local emergency management agencies to help them access and understand USGS flood data so they can make informed decisions and protect lives and property. USGS maintains two national response coordination teams -- the inland Flood Team and the Coastal Storm Team -- that liaise with our external partners and ensure a unified and effective response to major flood events. The response coordination teams supplement USGS operations and networks to acquire additional priority flood data to meet partner needs.
Learn more about how we study floods, how we measure and map flooding, and how we support flood event response by exploring the links listed on the Science tab.
Featured Flood Products
The USGS offers multiple products to help visualize current flood conditions, estimate flood quantiles, evaluate how large floods measure up historically, and access USGS flood response activities and data, including:
- Water Data for the Nation delivery tools
- National Water Dashboard: Access current flood and high-flow conditions, along with other streamflow information.
- WaterAlert: The WaterAlert service provides notifications to your email or phone for changes in water conditions based on thresholds you choose at USGS streamgages of interest to you.
- State Pages: Access current water conditions from all monitoring locations in a state that collect continuous data records
- Explore Water Data: A dynamic tool to filter and locate monitoring locations and water data that meet customizable use cases, such as flooding comparisons.
- Hydrologic Imagery Visualization and Information System (HIVIS): View still-frame images and timelapse videos from over 1,000 active webcams.
- Real-Time Flood Impact API: Displays locations where surveyed critical safety or infrastructure features near a USGS streamgage may be currently flooded.
- Flood Event Viewer: Explore streamflow, storm tide, wave height, high-water marks, and deployed sensor data for current and historical storm events.
- Flood Inundation Mapper: Explore sets of local inundation maps that show where flooding would occur – and how deep it might be - given a selected stream condition
- StreamStats web application and web page: Explore flood statistics at USGS streamgages, plot current conditions with respect to flood statistics, and provide estimates of flood quantiles at ungaged locations.
Below are other science projects associated with USGS flood information and activities.
Water Data Visualizations
Flood Inundation Mapping (FIM) Program
High-Water Marks
Coastal Storm Modeling System (CoSMoS)
Rapid Deployment Gages (RDGs)
StreamStats
Streamgaging Basics
Surge, Wave, and Tide Hydrodynamics (SWaTH) Network
Providing Major Storm and Short-Term Flood Event Data
Historical Flooding
Hurricanes
Floods and Recurrence Intervals
Flood Event Viewer: Hurricane Ian data collection near Fort Myers, Florida
Flood Event Viewer: Hurricane Ian data collection near Fort Myers, FloridaDuring major storms or other short-term events, the USGS collects streamflow and additional data (including storm tide, wave height, high-water marks, and additional sensor deployments) to aid in documenting flood events.
Flood Event Viewer: Hurricane Ian data collection near Fort Myers, Florida
Flood Event Viewer: Hurricane Ian data collection near Fort Myers, FloridaDuring major storms or other short-term events, the USGS collects streamflow and additional data (including storm tide, wave height, high-water marks, and additional sensor deployments) to aid in documenting flood events.
Screen capture displaying areas of inundation within the City of Elizabeth for a flood event generated from a Flood Inundation Mapper.
Screen capture displaying areas of inundation within the City of Elizabeth for a flood event generated from a Flood Inundation Mapper.
Real-Time Flood Impact Map: flooded road impact location in St. Paul, MN
Real-Time Flood Impact Map: flooded road impact location in St. Paul, MNClicking on a flood feature icon in the USGS Real-Time Flood Impact Map will display information about that Flood Impact Location, the current conditions at the nearby USGS streamgage, and the USGS HIVIS webcam image (if available). For example, this Flood Impact Location in St.
Real-Time Flood Impact Map: flooded road impact location in St. Paul, MN
Real-Time Flood Impact Map: flooded road impact location in St. Paul, MNClicking on a flood feature icon in the USGS Real-Time Flood Impact Map will display information about that Flood Impact Location, the current conditions at the nearby USGS streamgage, and the USGS HIVIS webcam image (if available). For example, this Flood Impact Location in St.
Westernport, Maryland was one of the hardest hit towns during the mid-May flooding in Western Maryland, where Georges Creek flooded an elementary school in Westernport, MD, prompting the emergency rescue of schoolchildren.
Westernport, Maryland was one of the hardest hit towns during the mid-May flooding in Western Maryland, where Georges Creek flooded an elementary school in Westernport, MD, prompting the emergency rescue of schoolchildren.
Real-Time Flood Impact Map: active flood impact locations during April 2025 flooding near Indianapolis, IN
Real-Time Flood Impact Map: active flood impact locations during April 2025 flooding near Indianapolis, INScreenshot of the USGS Real-Time Flood Impact Map on April 9, 2025, near Indianapolis, IN. Multiple streams and rivers experienced spring flooding, overtopping their embankments and affecting nearby roads, buildings, bridges, and more.
Real-Time Flood Impact Map: active flood impact locations during April 2025 flooding near Indianapolis, IN
Real-Time Flood Impact Map: active flood impact locations during April 2025 flooding near Indianapolis, INScreenshot of the USGS Real-Time Flood Impact Map on April 9, 2025, near Indianapolis, IN. Multiple streams and rivers experienced spring flooding, overtopping their embankments and affecting nearby roads, buildings, bridges, and more.
Kennebec River in downtown Augusta, Maine during flooding and normal flow
Kennebec River in downtown Augusta, Maine during flooding and normal flowKennebec River in downtown Augusta, Maine during flooding and normal flow. The left photo was taken on December 19, 2023 after a heavy rainstorm. The right photo was taken in September 2024.
Kennebec River in downtown Augusta, Maine during flooding and normal flow
Kennebec River in downtown Augusta, Maine during flooding and normal flowKennebec River in downtown Augusta, Maine during flooding and normal flow. The left photo was taken on December 19, 2023 after a heavy rainstorm. The right photo was taken in September 2024.
A cross-sectional view of a hypothetical river showing one possible arrangement of the three Federal Flood Risk Management Standard (FFRMS) floodplain elevations (Climate-Informed Science Approach, the Freeboard Value Approach, and the 0.2% Annual-Chance Flood Approach) above the current Base Flood Elevation, i.e., the 1% annual-chance flood elevation.
A cross-sectional view of a hypothetical river showing one possible arrangement of the three Federal Flood Risk Management Standard (FFRMS) floodplain elevations (Climate-Informed Science Approach, the Freeboard Value Approach, and the 0.2% Annual-Chance Flood Approach) above the current Base Flood Elevation, i.e., the 1% annual-chance flood elevation.
A cross-sectional view of a hypothetical coastline showing one possible arrangement of the three Federal Flood Risk Management Standard (FFRMS) floodplain elevations (Climate-Informed Science Approach, the Freeboard Value Approach, and the 0.2% Annual-Chance Flood Approach) above the current Base Flood Elevation, i.e., the 1% annual-chance flood elevation.
A cross-sectional view of a hypothetical coastline showing one possible arrangement of the three Federal Flood Risk Management Standard (FFRMS) floodplain elevations (Climate-Informed Science Approach, the Freeboard Value Approach, and the 0.2% Annual-Chance Flood Approach) above the current Base Flood Elevation, i.e., the 1% annual-chance flood elevation.
Measuring a High-Water Mark at the Androscoggin River in Topsham, Maine
Measuring a High-Water Mark at the Androscoggin River in Topsham, MaineA hydrologic technician measures a high-water mark near the Androscoggin River in Topsham, Maine days after a significant flood event in late December 2023. A combination of heavy rainfall and snowmelt prompted the flooding.
Measuring a High-Water Mark at the Androscoggin River in Topsham, Maine
Measuring a High-Water Mark at the Androscoggin River in Topsham, MaineA hydrologic technician measures a high-water mark near the Androscoggin River in Topsham, Maine days after a significant flood event in late December 2023. A combination of heavy rainfall and snowmelt prompted the flooding.
A high-water mark tag nailed to a tree trunk with visible debris. The debris that adheres to the tree is the physical evidence of how high the flood waters rose during the flood event; when the waters recede, the debris transported by the flood waters that was floating on the top of the water sticks to the tree.
A high-water mark tag nailed to a tree trunk with visible debris. The debris that adheres to the tree is the physical evidence of how high the flood waters rose during the flood event; when the waters recede, the debris transported by the flood waters that was floating on the top of the water sticks to the tree.
It’s an age-old question: If the river floods and no one sees it, did it flood? Yes! High water events leave behind clues such as debris that USGS scientists can observe to indirectly estimate the water level and streamflow during the event.
It’s an age-old question: If the river floods and no one sees it, did it flood? Yes! High water events leave behind clues such as debris that USGS scientists can observe to indirectly estimate the water level and streamflow during the event.
Section of Fort Myers Beach before and after Hurricane Ian
Section of Fort Myers Beach before and after Hurricane IanSection of Fort Myers Beach, Florida, before and after Hurricane Ian, 2022. The area endured severe damage and coastal change from the storm including overwashed sand, coastal flooding, and in some places, erosion.
Section of Fort Myers Beach before and after Hurricane Ian
Section of Fort Myers Beach before and after Hurricane IanSection of Fort Myers Beach, Florida, before and after Hurricane Ian, 2022. The area endured severe damage and coastal change from the storm including overwashed sand, coastal flooding, and in some places, erosion.
Landsat images from March of 2018 and March of 2019 show a stretch of the Missouri, Platte, and Elkhorn rivers in a full scene that stretches from just north of Sioux City, IA, to south of Omaha, NE. The first image shows the rivers at normal levels.
Landsat images from March of 2018 and March of 2019 show a stretch of the Missouri, Platte, and Elkhorn rivers in a full scene that stretches from just north of Sioux City, IA, to south of Omaha, NE. The first image shows the rivers at normal levels.
Hurricane Harvey flooding at Addicks Reservoir, Houston TX
Hurricane Harvey flooding at Addicks Reservoir, Houston TXAddicks Reservoir, Houston TX. Before image (8/29/2017) shows Hurricane Harvey flooding. Reservoir level was 108.8 feet at the time of the picture; the peak was 109.09 feet on 8/30. After image (4/6/2018) is eight months after the flooding; reservoir level was 69.45 ft.
Hurricane Harvey flooding at Addicks Reservoir, Houston TX
Hurricane Harvey flooding at Addicks Reservoir, Houston TXAddicks Reservoir, Houston TX. Before image (8/29/2017) shows Hurricane Harvey flooding. Reservoir level was 108.8 feet at the time of the picture; the peak was 109.09 feet on 8/30. After image (4/6/2018) is eight months after the flooding; reservoir level was 69.45 ft.
Hurricane Ida made landfall as a Category 4 hurricane in Louisiana, and brought widespread precipitation and flooding along its path and up the northeastern coast of U.S. in the following week.
Hurricane Ida made landfall as a Category 4 hurricane in Louisiana, and brought widespread precipitation and flooding along its path and up the northeastern coast of U.S. in the following week.
100-Year Flood - It's All About Chance poster image
100-Year Flood - It's All About Chance poster image
USGS measures spring flooding at Chesapeake bay's largest tributary
USGS measures spring flooding at Chesapeake bay's largest tributaryA USGS field team, to include Pat Bowen, Kate Bowen and John Trainor, uses specialized equipment to measure spring floodwaters at Chesapeake Bay's largest tributary, the Susquehanna River in Maryland.
USGS measures spring flooding at Chesapeake bay's largest tributary
USGS measures spring flooding at Chesapeake bay's largest tributaryA USGS field team, to include Pat Bowen, Kate Bowen and John Trainor, uses specialized equipment to measure spring floodwaters at Chesapeake Bay's largest tributary, the Susquehanna River in Maryland.
USGS hydrographer makes a flood measurement in Tusten, NY
USGS hydrographer makes a flood measurement in Tusten, NYUSGS hydrographer Dave Thompson makes a near-peak flood measurement off a bridge at Tenmile River in Tusten, New York.
USGS hydrographer makes a flood measurement in Tusten, NY
USGS hydrographer makes a flood measurement in Tusten, NYUSGS hydrographer Dave Thompson makes a near-peak flood measurement off a bridge at Tenmile River in Tusten, New York.
USGS hydrographer Brent Hanson wades out in freezing waters to collect flood measurements on the Sheyenne River near Cooperstown, North Dakota. Hanson reads an outside staff, which is a vertical graduated ruler used to calibrate the continuous readings of water level provided by electronic sensors.
USGS hydrographer Brent Hanson wades out in freezing waters to collect flood measurements on the Sheyenne River near Cooperstown, North Dakota. Hanson reads an outside staff, which is a vertical graduated ruler used to calibrate the continuous readings of water level provided by electronic sensors.
A frozen USGS rapid deployment streamgage measures the height of the Maple River near Page, North Dakota. RDGs can be installed on short notice to provide additional information at locations that are normally not gauged.
A frozen USGS rapid deployment streamgage measures the height of the Maple River near Page, North Dakota. RDGs can be installed on short notice to provide additional information at locations that are normally not gauged.
What are the two types of floods? What are the two types of floods?
There are two basic types of floods: flash floods and the more widespread river floods. Flash floods generally cause greater loss of life and river floods generally cause greater loss of property. A flash flood occurs when runoff from excessive rainfall causes a rapid rise in the water height (stage) of a stream or normally-dry channel. Flash floods are more common in areas with a dry climate and...
How are floods predicted? How are floods predicted?
Flood predictions require several types of data: The amount of rainfall occurring on a real-time basis. The rate of change in river stage on a real-time basis, which can help indicate the severity and immediacy of the threat. Knowledge about the type of storm producing the moisture, such as duration, intensity and areal extent, which can be valuable for determining possible severity of the...
Where can I find flood maps? Where can I find flood maps?
FEMA is the official public source for flood maps for insurance purposes: FEMA’s Flood Map Service Center FEMA’s National Flood Hazard Layer NOAA is responsible for producing flood forecast maps that combine precipitation data with USGS streamflow data: NWS - National Water Prediction Service: River forecasts and long range flood outlook Coastal Inundation Dashboard: Real-time and historical...
We had a "100-year flood" two years in a row. How can that be? We had a "100-year flood" two years in a row. How can that be?
The term "100-year flood" is used to describe the recurrence interval of floods. The 100-year recurrence interval means that a flood of that magnitude has a one percent chance of occurring in any given year. In other words, the chances that a river will flow as high as the 100-year flood stage this year is 1 in 100. Statistically, each year begins with the same 1-percent chance that a 100-year...
Does an increase in the 100-year flood estimate originate from climate or land-use change? Does an increase in the 100-year flood estimate originate from climate or land-use change?
Climate variability (dry cycles to wet cycles) and land-use change play a significant role, but there is a large amount of uncertainty around the flood quantile estimates (the value of discharge corresponding to the 100-year flood), particularly if there isn’t a long record of observed data at a stream location. Learn more: The 100-Year Flood The 100-Year Flood--It's All About Chance
How can a 1,000-year rainfall not result in a 1,000-year flood? How can a 1,000-year rainfall not result in a 1,000-year flood?
It comes down to a number of factors, including the pattern of movement of the rainstorm in each particular watershed, the conditions of the soil and plant matter in the watershed, and the timing of the rainstorm in one watershed versus other watersheds. For example, if the ground is already saturated before a rainstorm, much of the rain will run off into streams, but if the ground is dry, it will...
What is a 1,000-year flood? What is a 1,000-year flood?
The term “1,000-year flood” means that, statistically speaking, a flood of that magnitude (or greater) has a 1 in 1,000 chance of occurring in any given year. In terms of probability, the 1,000-year flood has a 0.1% chance of happening in any given year. These statistical values are based on observed data.
Why do the values for the 100-year flood seem to change with every flood? Why do the values for the 100-year flood seem to change with every flood?
The amount of water corresponding to a 100-year flood, a 500-year flood, or a 1,000-year flood is known as a "flood quantile." For instance, on a given river, the flood quantile corresponding to the 50-year flood might be 10,000 cubic feet per second (cfs) and the flood quantile corresponding to the 100-year flood might be 15,000 cfs. The estimates of the flood quantiles are calculated using...
How can I obtain river forecasts (flood forecasts)? How can I obtain river forecasts (flood forecasts)?
River forecasts (flood forecasts) are made by the National Weather Service - National Water Prediction Service. The overall map on the website uses color designations to give a quick overview of current conditions. A legend and other information can be selected in the right column. From the main map, click on a station to bring up a box which includes a graph showing current information and a...