Geoscience Australia senior leaders visiting USGS Electron Microbeam Laboratory
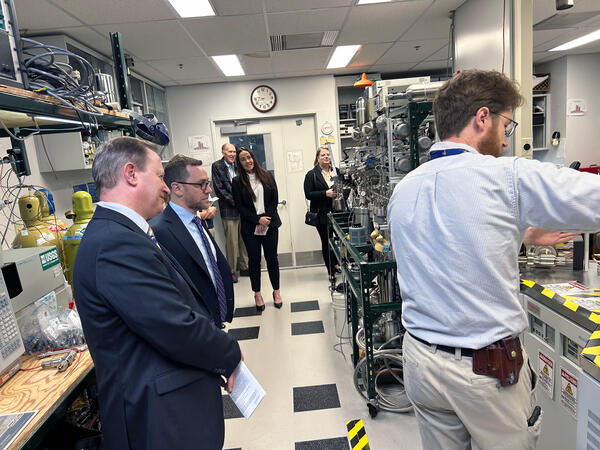
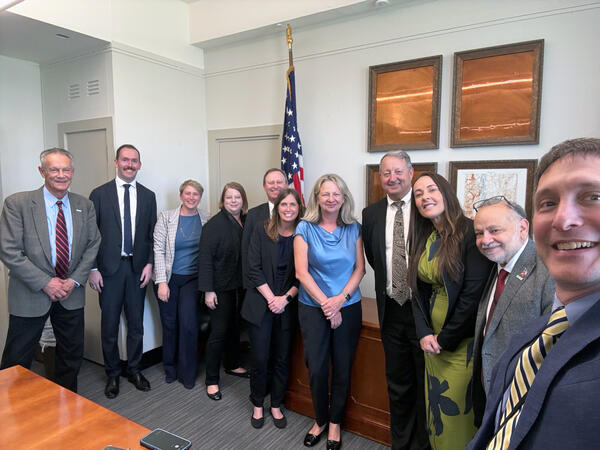
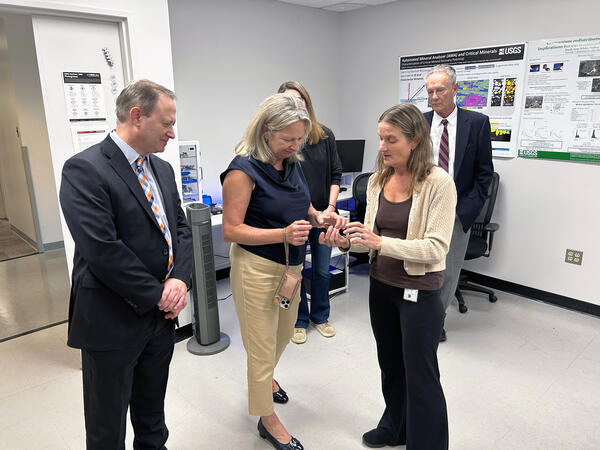
Geoscience Australia senior leaders visiting USGS Electron Microbeam LaboratoryDuring their time in Reston, the Geoscience Australia (GA) delegation met with USGS experts across minerals, energy, water, and Earth observation mission areas. They toured several USGS facilities, including Electron Microbeam Laboratory in the Geology, Energy, and Minerals Science Center.