
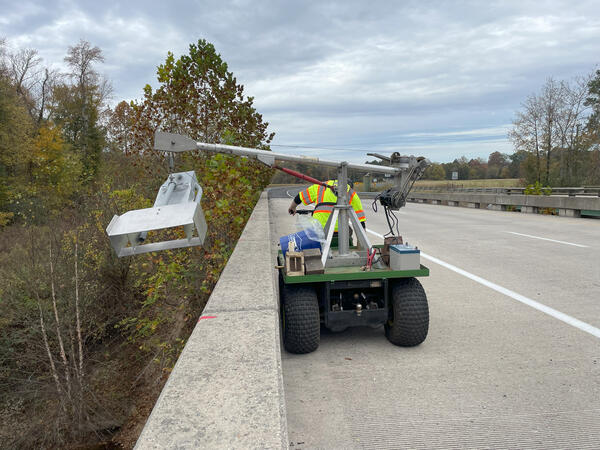
A USGS mobile laboratory vehicle out in the field before dawn near the Lynnwood monitoring site: S F Shenandoah River Near Lynnwood, VA - USGS Water Data for the Nation
Images
Images intro.
Filter Total Items: 308

USGS Mobile Laboratory Vehicle in the Field
A USGS mobile laboratory vehicle out in the field before dawn near the Lynnwood monitoring site: S F Shenandoah River Near Lynnwood, VA - USGS Water Data for the Nation

North Fork Shenandoah River at Dawn
The North Fork Shenandoah River near the Lynnwood monitoring station at dawn.
This photo was taken as a part of the Shenandoah River HABs Project.
The North Fork Shenandoah River near the Lynnwood monitoring station at dawn.
This photo was taken as a part of the Shenandoah River HABs Project.

Measuring Bank Erosion along Accotink Creek
Accotink Creek is an urban stream in Fairfax County, Virginia. Like many urban streams, its banks are heavily eroded, and that eroded sediment is transported downstream. This impacts downstream water quality and contributes to lake sedimentation in Lake Accotink.
Accotink Creek is an urban stream in Fairfax County, Virginia. Like many urban streams, its banks are heavily eroded, and that eroded sediment is transported downstream. This impacts downstream water quality and contributes to lake sedimentation in Lake Accotink.

Accotink Creek
Accotink Creek is an urban creek and a tributary of Lake Accotink. Accotink Creek suffers from high rates of streambank erosion, which causes the steep, unstable banks seen on the far side of the creek in the above image.
Accotink Creek is an urban creek and a tributary of Lake Accotink. Accotink Creek suffers from high rates of streambank erosion, which causes the steep, unstable banks seen on the far side of the creek in the above image.

Water-quality Samples
Water quality samples collected at USGS monitoring station 01628500 - S F Shenandoah River Near Lynnwood, VA.
Water quality samples collected at USGS monitoring station 01628500 - S F Shenandoah River Near Lynnwood, VA.
Bedload Sampler
USGS staff preparing to deploy a bedload sampler.
What is bedload?
USGS staff preparing to deploy a bedload sampler.
What is bedload?

Bedload Sampling
USGS staff retrieving a bedload sampler from a riverbed.
What is bedload?
USGS staff retrieving a bedload sampler from a riverbed.
What is bedload?

Bedload Sampling
USGS staff preparing to deploy a bedload sampler into the river below.
What is bedload?
USGS staff preparing to deploy a bedload sampler into the river below.
What is bedload?

Deploying a Bedload Sampler
USGS staff preparing to deploy a bedload sampler.
What is bedload?
USGS staff preparing to deploy a bedload sampler.
What is bedload?

USGS geologists document potential paleoliquefaction features from past seismicity at the southernmost edge of the Central Virginia Seismic Zone
USGS geologists document potential paleoliquefaction features from past seismicity at the southernmost edge of the Central Virginia Seismic ZoneUSGS geologists document potential paleoliquefaction features from past seismicity at the southernmost edge of the Central Virginia Seismic Zone. Radiocarbon data suggest these features along Fountain Creek near Skippers, VA may be related to an earthquake that occurred near Petersburg, VA in the late 1700s.
Fountain Creek, Skippers, Virginia

Accotink Creek
Upper Accotink Creek is the longer of the of two streams that feed Lake Accotink. The USGS has been monitoring water quality in Accokink Creek since 2011, and has been monitoring water depth in the creek as far back as 1947.
Upper Accotink Creek is the longer of the of two streams that feed Lake Accotink. The USGS has been monitoring water quality in Accokink Creek since 2011, and has been monitoring water depth in the creek as far back as 1947.
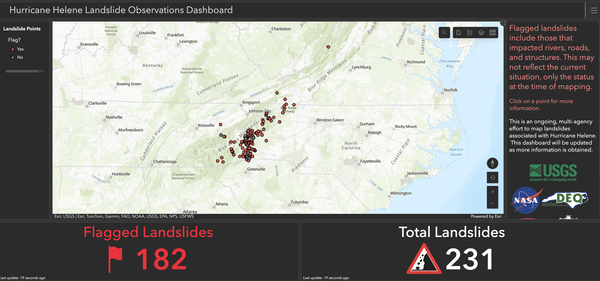
USGS landslide event team activated in wake of Hurricane Helene
USGS landslide event team activated in wake of Hurricane HeleneThe Landslide Observation Dashboard, a multi-agency effort to map where landslides have occurred in the southern Appalachian Mountains, launched September 30, 2024, as a “timely best science” provisional interface that can be used by the general public and local authorities as they prioritize resources.

USGS landslide event team activated in wake of Hurricane Helene
USGS landslide event team activated in wake of Hurricane HeleneU.S. Geological Survey landslide experts conduct an aerial reconnaissance flight October 3, 2024, over the southern Appalachian Mountains to get a better understanding of the extent and severity of landslide impacts in the wake of Hurricane Helene, which brought widespread flooding and destruction. (USGS photo by Ben Mirus).

Lake Accotink Dam
The Lake Accotink dam.
Lake Accotink is a 55-acre lake that is greatly valued to the local community. High sediment loads puts this lake at risk of becoming a wetland if not regularly dredged.
The Lake Accotink dam.
Lake Accotink is a 55-acre lake that is greatly valued to the local community. High sediment loads puts this lake at risk of becoming a wetland if not regularly dredged.

Lake Accotink
Lake Accotink is a 55-acre lake that is greatly valued to the local community. High sediment loads puts this lake at risk of becoming a wetland if not regularly dredged.
Lake Accotink is a 55-acre lake that is greatly valued to the local community. High sediment loads puts this lake at risk of becoming a wetland if not regularly dredged.

Lake Accotink Dam
The Lake Accotink dam.
Lake Accotink is a 55-acre lake that is greatly valued to the local community. High sediment loads puts this lake at risk of becoming a wetland if not regularly dredged.
The Lake Accotink dam.
Lake Accotink is a 55-acre lake that is greatly valued to the local community. High sediment loads puts this lake at risk of becoming a wetland if not regularly dredged.

HAB event in the South Fork Shenandoah River
The South Fork of the Shenandoah River during a harmful algal bloom (HAB) event. A USGS scientist wades into the river to collect readings. Mats of algae float at the surface while filamentous algae coats the riverbed.
The South Fork of the Shenandoah River during a harmful algal bloom (HAB) event. A USGS scientist wades into the river to collect readings. Mats of algae float at the surface while filamentous algae coats the riverbed.

Outreach Event at War Branch
The USGS and local partners hosted a meeting at the War Branch monitoring station to share water-quality and conservation work happening in the watershed with farmers, environmental and agricultural agencies, nonprofit groups, and local universities.
The USGS and local partners hosted a meeting at the War Branch monitoring station to share water-quality and conservation work happening in the watershed with farmers, environmental and agricultural agencies, nonprofit groups, and local universities.

Water Quality Sampling Equipment Show-and-Tell
USGS scientists Jimmy Webber and Dan Burns explain how water quality equipment is used to take measurements at War Branch and other monitoring stations.
USGS scientists Jimmy Webber and Dan Burns explain how water quality equipment is used to take measurements at War Branch and other monitoring stations.

Shallow Groundwater Sample from the Banks of the Shenandoah River
Shallow Groundwater Sample from the Banks of the Shenandoah RiverA groundwater sample taken from a shallow piezometer near USGS surface water monitoring station 01634000 near Strausburg.
Shallow Groundwater Sample from the Banks of the Shenandoah River
Shallow Groundwater Sample from the Banks of the Shenandoah RiverA groundwater sample taken from a shallow piezometer near USGS surface water monitoring station 01634000 near Strausburg.