
USGS technician Dan Burns takes measurements along a geomorphic creek transect.
Images
Images intro.
Filter Total Items: 308

Taking Erosion and Deposition Measurements
USGS technician Dan Burns takes measurements along a geomorphic creek transect.

Measuring a Geomorphic Transect Pin
A USGS technician measures a geomorphic transect pin.
A USGS technician measures a geomorphic transect pin.
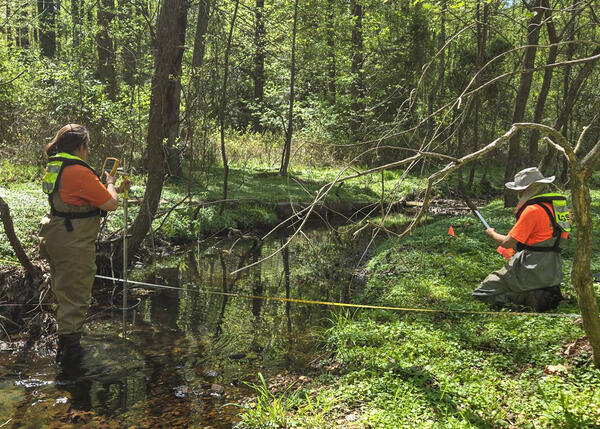
Spring habitat assessment
Technicians Laura Yates and Erik Kaseloo complete field activities for a spring habitat assessment at at U.S. Geological Survey streamgage station 0164579245, The Glade, near Pegasus Lane at Reston, VA, on April 24, 2025.
Spring 2025 Photo Contest Winner: Taylor Camper, Honorable Mention category
Technicians Laura Yates and Erik Kaseloo complete field activities for a spring habitat assessment at at U.S. Geological Survey streamgage station 0164579245, The Glade, near Pegasus Lane at Reston, VA, on April 24, 2025.
Spring 2025 Photo Contest Winner: Taylor Camper, Honorable Mention category

Taking Levels at a Stormwater Conveyance Channel
Two USGS hydrologic technicians taking GPS levels at the Ramsgate Conveyance Channel near Great Bridge, Virginia.
Data for this site can be found at USGS Water Data for the Nation.
Two USGS hydrologic technicians taking GPS levels at the Ramsgate Conveyance Channel near Great Bridge, Virginia.
Data for this site can be found at USGS Water Data for the Nation.
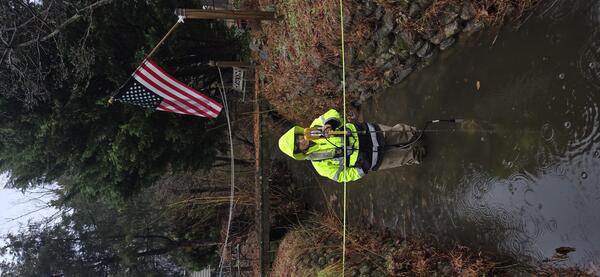
USGS hydrologic technician Chelsea Vande Pol collects a discharge measurement downstream of a storm drain in Hampton Roads, VA
USGS hydrologic technician Chelsea Vande Pol collects a discharge measurement downstream of a storm drain in Hampton Roads, VAUSGS hydrologic technician Chelsea Vande Pol collects a discharge measurement downstream of a storm drain in Hampton Roads, VA.
Winter 2025 Photo Contest Winner: Taylor Camper, Honorable Mention category

Landsat Mosaic of the Chesapeake Bay
The Chesapeake Bay is the largest estuary in the United States. Located in the Mid-Atlantic region of the East Coast, it runs north-south from the mouth of the Susquehanna River near Havre de Grace, Maryland, to the Atlantic Ocean near Virginia Beach, Virginia.
The Chesapeake Bay is the largest estuary in the United States. Located in the Mid-Atlantic region of the East Coast, it runs north-south from the mouth of the Susquehanna River near Havre de Grace, Maryland, to the Atlantic Ocean near Virginia Beach, Virginia.

Annual NLCD for the Chesapeake Bay Region
The Chesapeake Bay watershed has experienced substantial population growth over the last several decades. Since 1950, the population has more than doubled, and between 1980 and 2023, the number increased from 12.7 million to 18.6 million.
The Chesapeake Bay watershed has experienced substantial population growth over the last several decades. Since 1950, the population has more than doubled, and between 1980 and 2023, the number increased from 12.7 million to 18.6 million.

Landsat Level-3 Dynamic Surface Water Extent of the Chesapeake Bay
Landsat Level-3 Dynamic Surface Water Extent of the Chesapeake BayThe Chesapeake Bay is roughly 200 miles (322 kilometers) in length and varies in width from a mere 4 miles (6.4 kilometers) near Aberdeen, Maryland, to 30 miles (48 kilometers) near Cape Charles, Virginia.

Landsat Level-2 Provisional Aquatic Reflectance of the Chesapeake Bay
Landsat Level-2 Provisional Aquatic Reflectance of the Chesapeake BayThe Chesapeake Bay watershed spans more than 64,000 square miles (166,000 square kilometers) and encompasses parts of six states—Delaware, Maryland, New York, Pennsylvania, Virginia, and West Virginia—and the District of Columbia.

Virginia Extensometers Depth Comparison
How Deep Do We Drill?

Landsat Collection 2 Level-2 Science Products
The USGS provides research-quality, applications-ready Landsat Level-2 and Level-3 science products to support an array of land surface change studies. Collection 2 Level-2 scene-based science products include Surface Reflectance, Surface Temperature, Surface Reflectance-Derived Spectral Indices, and Provisional Aquatic Reflectance.
The USGS provides research-quality, applications-ready Landsat Level-2 and Level-3 science products to support an array of land surface change studies. Collection 2 Level-2 scene-based science products include Surface Reflectance, Surface Temperature, Surface Reflectance-Derived Spectral Indices, and Provisional Aquatic Reflectance.

Lake Accotink Infilling
Lake Accotink is a 55 acre lake in Fairfax county which suffers from high rates of sedimentation. As the lake fills with sediment, it loses volume. This animations shows how the lake might continue to lose volume over time if dredging does not continue.
Lake Accotink is a 55 acre lake in Fairfax county which suffers from high rates of sedimentation. As the lake fills with sediment, it loses volume. This animations shows how the lake might continue to lose volume over time if dredging does not continue.

Lake Accotink Sediment Flow
Lake Accotink is a 55 acre lake in Fairfax county which suffers from high rates of sedimentation. The lake is fed by Accotink Creek, which includes the Long Branch tributary. These two streams deliver most of the sediment to Lake Accotink.
Lake Accotink is a 55 acre lake in Fairfax county which suffers from high rates of sedimentation. The lake is fed by Accotink Creek, which includes the Long Branch tributary. These two streams deliver most of the sediment to Lake Accotink.

The USGS West Point Extensometer
The USGS West Point pipe extensometer (56J 49) with a total depth of 1,371 feet. Data for this site can be found on USGS Water Data for the Nation.
The USGS West Point pipe extensometer (56J 49) with a total depth of 1,371 feet. Data for this site can be found on USGS Water Data for the Nation.

Installing GNSS at the West Point Subsidence Superstation
Installing GNSS at the West Point Subsidence SuperstationA USGS technician, Daniel Markey, works to connect GNSS sensors to the instrument table of the West Point extensometer at the West Point Subsidence Superstation.
Installing GNSS at the West Point Subsidence Superstation
Installing GNSS at the West Point Subsidence SuperstationA USGS technician, Daniel Markey, works to connect GNSS sensors to the instrument table of the West Point extensometer at the West Point Subsidence Superstation.

The extensometer shed at West Point.
The building housing the West Point extensometer. The actual extensometer can be seen inside through the open doors.
The building housing the West Point extensometer. The actual extensometer can be seen inside through the open doors.

The West Point Extensometer
The USGS West Point pipe extensometer (56J 49) with a total depth of 1,371 feet. Data for this site can be found on USGS Water Data for the Nation.
The USGS West Point pipe extensometer (56J 49) with a total depth of 1,371 feet. Data for this site can be found on USGS Water Data for the Nation.

Balancing the West Point Extensometer
Two USGS scientists balance the West Point extensometer's fulcrum arm prior to the instrument's activation.
Two USGS scientists balance the West Point extensometer's fulcrum arm prior to the instrument's activation.