Dragonfly Mercury Project specimen collection in Glacier NP
Dragonfly Mercury Project specimen collection in Glacier NPResearchers instruct volunteers on how to collect dragonfly larvae in Glacier NP as a part of the Dragonfly Mercury Project.

Official websites use .gov
A .gov website belongs to an official government organization in the United States.
Secure .gov websites use HTTPS
A lock () or https:// means you’ve safely connected to the .gov website. Share sensitive information only on official, secure websites.
Images from Region 4.

Researchers instruct volunteers on how to collect dragonfly larvae in Glacier NP as a part of the Dragonfly Mercury Project.
Researchers instruct volunteers on how to collect dragonfly larvae in Glacier NP as a part of the Dragonfly Mercury Project.
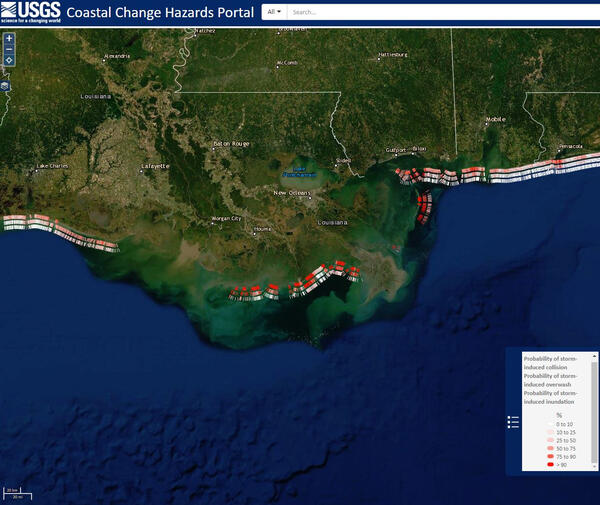
This Coastal Change Storm Hazard Team map was created Friday, July 12, 2019 and shows forecast beach erosion (the strip of colored bars closest to the coast), overwash (middle strip) and inundation (outer strip) effects of Tropical Storm Barry’s predicted landfall in Louisiana.
This Coastal Change Storm Hazard Team map was created Friday, July 12, 2019 and shows forecast beach erosion (the strip of colored bars closest to the coast), overwash (middle strip) and inundation (outer strip) effects of Tropical Storm Barry’s predicted landfall in Louisiana.
This Coastal Change Storm Hazard Team map was created Friday, July 12, 2019 and shows forecast beach erosion (the strip of colored bars closest to the coast), overwash (middle strip) and inundation (outer strip) effects of Tropical Storm Barry’s predicted landfall in Louisiana.
This Coastal Change Storm Hazard Team map was created Friday, July 12, 2019 and shows forecast beach erosion (the strip of colored bars closest to the coast), overwash (middle strip) and inundation (outer strip) effects of Tropical Storm Barry’s predicted landfall in Louisiana.

USGS technician Chris Broz helps take water measurements on the Big Sioux River during record flooding in March, 2019.
USGS technician Chris Broz helps take water measurements on the Big Sioux River during record flooding in March, 2019.

After record flooding on the Big Sioux River, USGS crews mobilized to take important water measurements.
After record flooding on the Big Sioux River, USGS crews mobilized to take important water measurements.

After record flooding on the Big Sioux River, USGS crews mobilized to take important water measurements.
After record flooding on the Big Sioux River, USGS crews mobilized to take important water measurements.

After record flooding on the Big Sioux River, USGS crews mobilized to take important water measurements.
After record flooding on the Big Sioux River, USGS crews mobilized to take important water measurements.

This is a graphic from the USGS National Oil and Gas Assessment Explorer application, which allows user to drill into 70 oil and gas assessment provinces throughout the United States.
This is a graphic from the USGS National Oil and Gas Assessment Explorer application, which allows user to drill into 70 oil and gas assessment provinces throughout the United States.
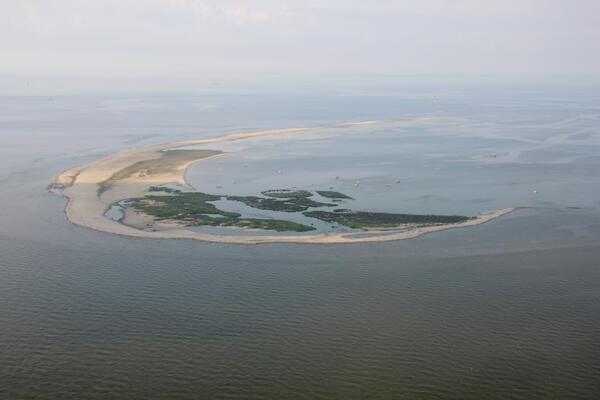
Aerial photograph looking southwest along Breton Island, Louisiana, taken July 2013
Aerial photograph looking southwest along Breton Island, Louisiana, taken July 2013

Bussell, Ashley M working on site, with Blue USGS Shirt.
Bussell, Ashley M working on site, with Blue USGS Shirt.

Eosin-nigrosin staining of spermatozoa from common carp (Cyprinus carpio) testes collected from the Lake Mead National Recreation Area, Nevada
Eosin-nigrosin staining of spermatozoa from common carp (Cyprinus carpio) testes collected from the Lake Mead National Recreation Area, Nevada
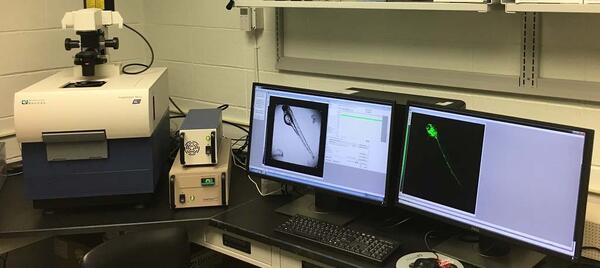
Molecular Devices ImageXpress† High-Content Imaging System
Molecular Devices ImageXpress† High-Content Imaging System
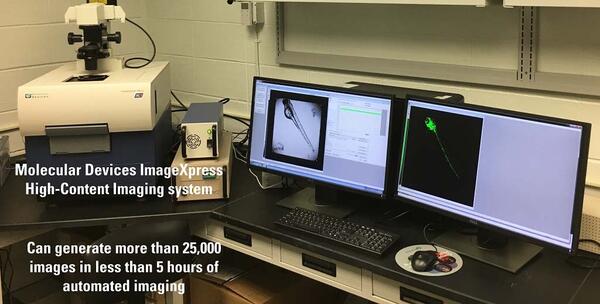
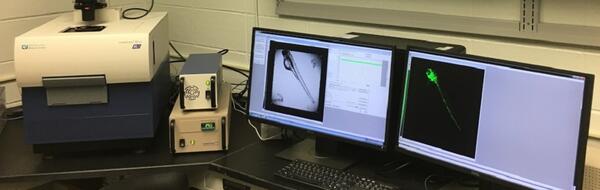
Molecular Devices ImageXpress† High-Content Imaging System that can generate more than 25,000 images in less than 5 hours of automated image acquisition.
Molecular Devices ImageXpress† High-Content Imaging System that can generate more than 25,000 images in less than 5 hours of automated image acquisition.
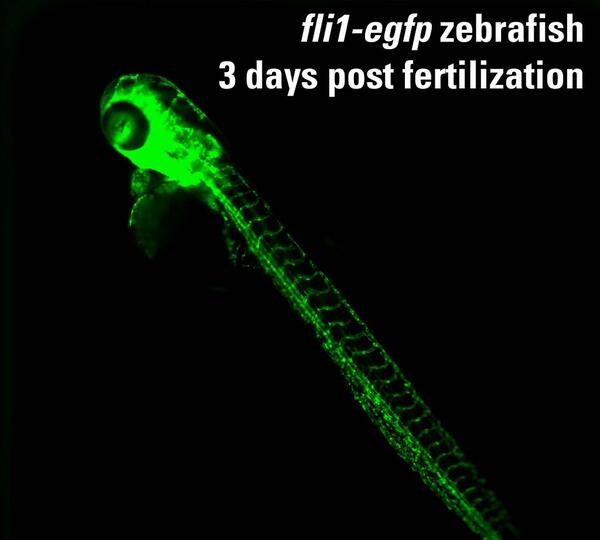
Using the 384-well plate format, a single zebrafish embryo is tested in each well. This is an example of a 72 hour post fertilization fli1:egfp zebrafish (3 millimeters long) imaged under a fluorescein isothiocyanate (FITC) filter.
Using the 384-well plate format, a single zebrafish embryo is tested in each well. This is an example of a 72 hour post fertilization fli1:egfp zebrafish (3 millimeters long) imaged under a fluorescein isothiocyanate (FITC) filter.

Microscopic video imaging is used for computerized analysis of sperm motility parameters
Microscopic video imaging is used for computerized analysis of sperm motility parameters

USGS hydrologist Taylor Dudunake assesses the rip-rap countermeasure along the pier of the Iowa State Route 76 bridge over the Upper Iowa River near Dorchester, Iowa. The assessment was part of a nationwide study of bridge scour countermeasures the USGS conducted on behalf of the Federal Highway Administration.
USGS hydrologist Taylor Dudunake assesses the rip-rap countermeasure along the pier of the Iowa State Route 76 bridge over the Upper Iowa River near Dorchester, Iowa. The assessment was part of a nationwide study of bridge scour countermeasures the USGS conducted on behalf of the Federal Highway Administration.

Real-time flow meter installed on a center-pivot irrigation well in Mississippi County, Arkansas as part of a cooperative project conducted between USGS and the Arkansas Natural Resources Commission. The meter will measure water use for irrigation, providing data which will help improve water-use information in other locations as well.
Real-time flow meter installed on a center-pivot irrigation well in Mississippi County, Arkansas as part of a cooperative project conducted between USGS and the Arkansas Natural Resources Commission. The meter will measure water use for irrigation, providing data which will help improve water-use information in other locations as well.
High-Content Screening Laboratory -- Columbia, Missouri
High-Content Screening Laboratory -- Columbia, Missouri
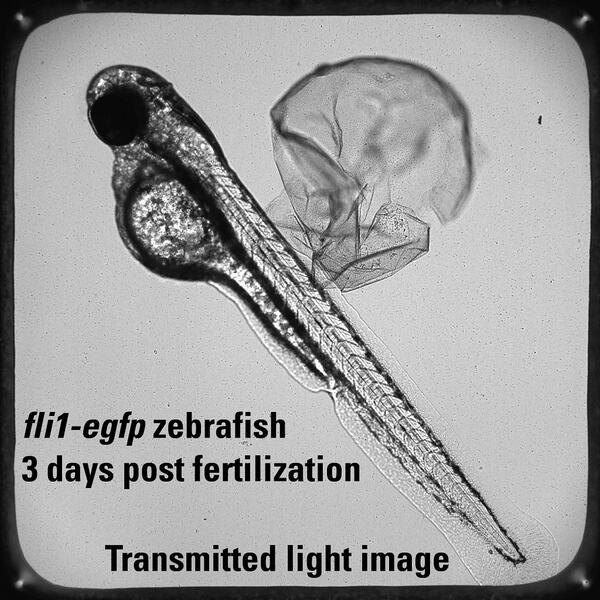
This is an example of a 72 hour post fertilization fli1:egfp zebrafish (3 millimeters long) imaged under transmitted light. The same imaging system with was used.
This is an example of a 72 hour post fertilization fli1:egfp zebrafish (3 millimeters long) imaged under transmitted light. The same imaging system with was used.
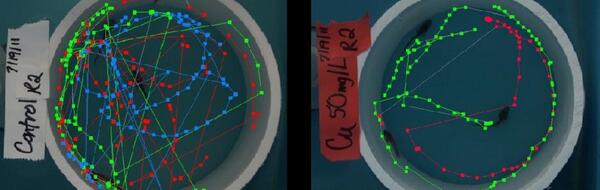
Behavioral Toxicology Laboratory -- Columbia, Missouri. Swimming paths of control (left) and copper (right) exposed fish
Behavioral Toxicology Laboratory -- Columbia, Missouri. Swimming paths of control (left) and copper (right) exposed fish
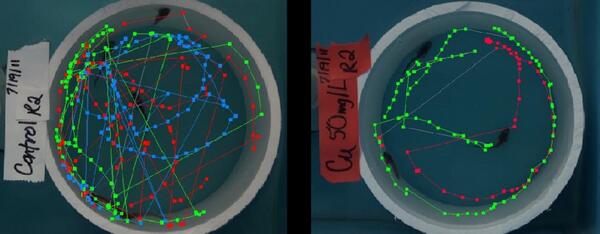
Behavioral Toxicology Laboratory — Columbia, Missouri. Swimming paths of control (left) and copper (right) exposed fish demonstrate changes in swimming behavior detected following exposure to metals. Such changes can impact ability of fish to survive.
Behavioral Toxicology Laboratory — Columbia, Missouri. Swimming paths of control (left) and copper (right) exposed fish demonstrate changes in swimming behavior detected following exposure to metals. Such changes can impact ability of fish to survive.