
Output images from the collected data of the Acoustic Dopler Current Profiler used for the ice measurement at USGS 01438500 Delaware River at Montague, New Jersey.
Multimedia
Multimedia products allows the New Jersey Water Science Center to distribute information in a visual medium.
Images
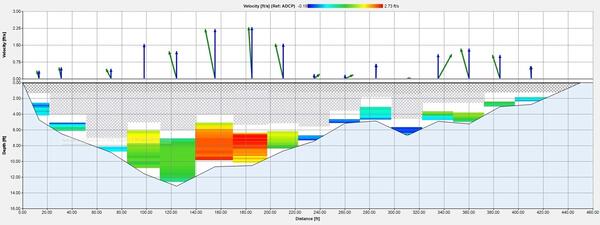
Montague Ice Stream Profile
Output images from the collected data of the Acoustic Dopler Current Profiler used for the ice measurement at USGS 01438500 Delaware River at Montague, New Jersey.
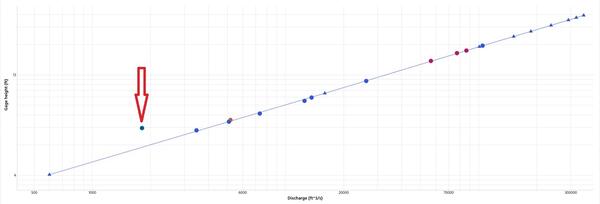
Delaware Ice Plot
Image of the Rating curve for 01438500 Delaware River at Montague, NJ, showing how the ice measurement compares to other measurements and expected flows at the site
Image of the Rating curve for 01438500 Delaware River at Montague, NJ, showing how the ice measurement compares to other measurements and expected flows at the site
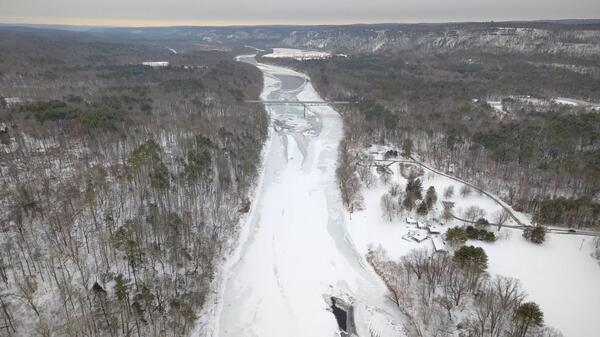
Montague Bridge Ice
Looking downstream along the frozen river at the Montague bridge and the USGS 01438500 Delaware River at Montague, New Jersey site
Looking downstream along the frozen river at the Montague bridge and the USGS 01438500 Delaware River at Montague, New Jersey site
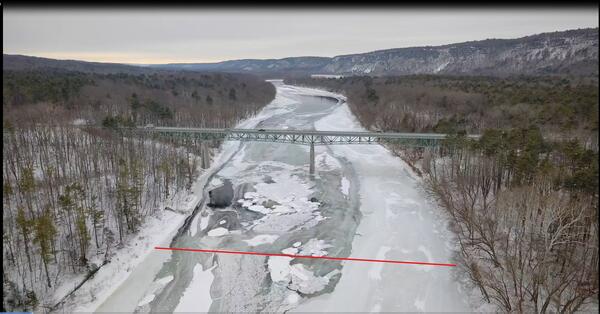
Delaware River Ice Cross-section
Looking downstream from an aerial view at USGS site 01438500 Delaware River at Montague, New Jersey and seeing the bridge over the frozen river with a red highlighted line indicating the intended measuring section for the ice measurement
Looking downstream from an aerial view at USGS site 01438500 Delaware River at Montague, New Jersey and seeing the bridge over the frozen river with a red highlighted line indicating the intended measuring section for the ice measurement
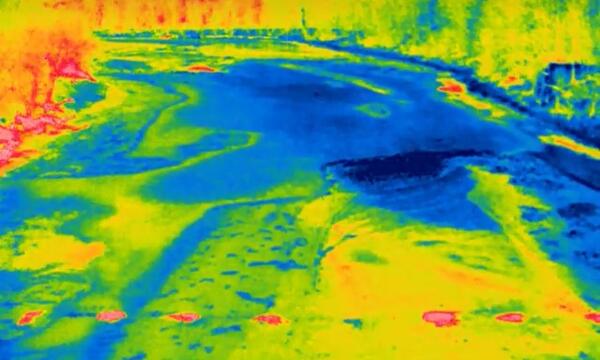
IR view of the ice work
Looking at the USGS 01483500 Delaware River at Montague, New Jersey through an Infra-red camera which shows the differences in the ice as shades of color. The red circles along the bottom are the boreholes where the warmer water below is exposed to the surface.
Looking at the USGS 01483500 Delaware River at Montague, New Jersey through an Infra-red camera which shows the differences in the ice as shades of color. The red circles along the bottom are the boreholes where the warmer water below is exposed to the surface.
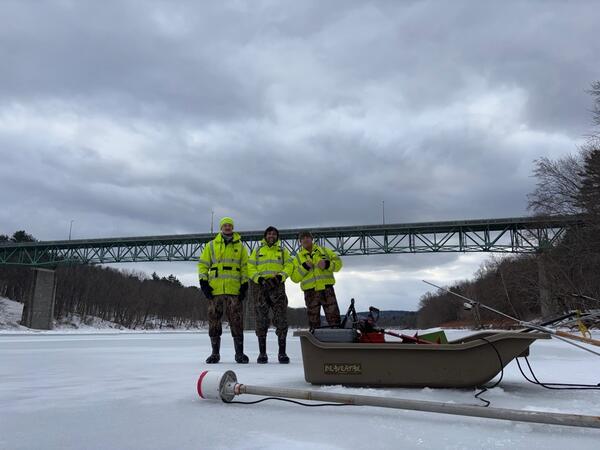
Beginning Ice Measurement
USGS Scientists Jon Suchy, Pat Bowen, and Jason Shvanda Standing on the frozen Delaware River at the USGS 01438500 Delaware River at Montague, New Jersey site with their ice measurement equipment as they prepare to make their measurement
USGS Scientists Jon Suchy, Pat Bowen, and Jason Shvanda Standing on the frozen Delaware River at the USGS 01438500 Delaware River at Montague, New Jersey site with their ice measurement equipment as they prepare to make their measurement
Videos

Press Conference — M 4.8 near Whitehouse Station, NJ
Press Conference — M 4.8 near Whitehouse Station, NJPress conference held at 12pm EST April 5, 2024.
Press Conference — M 4.8 near Whitehouse Station, NJ
Press Conference — M 4.8 near Whitehouse Station, NJPress conference held at 12pm EST April 5, 2024.

The USGS Northeast Region: Delivering Science for Better Decisions
The USGS Northeast Region: Delivering Science for Better DecisionsThis video is an introduction of the USGS Northeast Region's science efforts to support society's evolving needs through its engaged and skilled workforce.
The USGS Northeast Region: Delivering Science for Better Decisions
The USGS Northeast Region: Delivering Science for Better DecisionsThis video is an introduction of the USGS Northeast Region's science efforts to support society's evolving needs through its engaged and skilled workforce.

Hot Stream, Cold Stream – Measuring the impact of Groundwater on Stream Temperature
Hot Stream, Cold Stream – Measuring the impact of Groundwater on Stream TemperatureGroundwater that drains to surface water through seeps and springs is generally referred to as “discharge.” Groundwater discharge is a primary component of stream base flow, or streamflow that occurs between storms, periods of snowmelt runoff, and periods of quick soil drainage.
")
Hot Stream, Cold Stream – Measuring the impact of Groundwater on Stream Temperature (AD)
Hot Stream, Cold Stream – Measuring the impact of Groundwater on Stream Temperature (AD)Groundwater that drains to surface water through seeps and springs is generally referred to as “discharge.” Groundwater discharge is a primary component of stream base flow, or streamflow that occurs between storms, periods of snowmelt runoff, and periods of quick soil drainage.

What Do USGS Hydrologic Technicians Do For Water Quality Sampling and Analysis?
What Do USGS Hydrologic Technicians Do For Water Quality Sampling and Analysis?What do USGS Hydrologic Technicians do on the job for water quality sampling and analysis? This video features four different Hydrologic Technicians from New Jersey Water Science Center and Nevada Water Science Center sharing some of their work.
Webcams
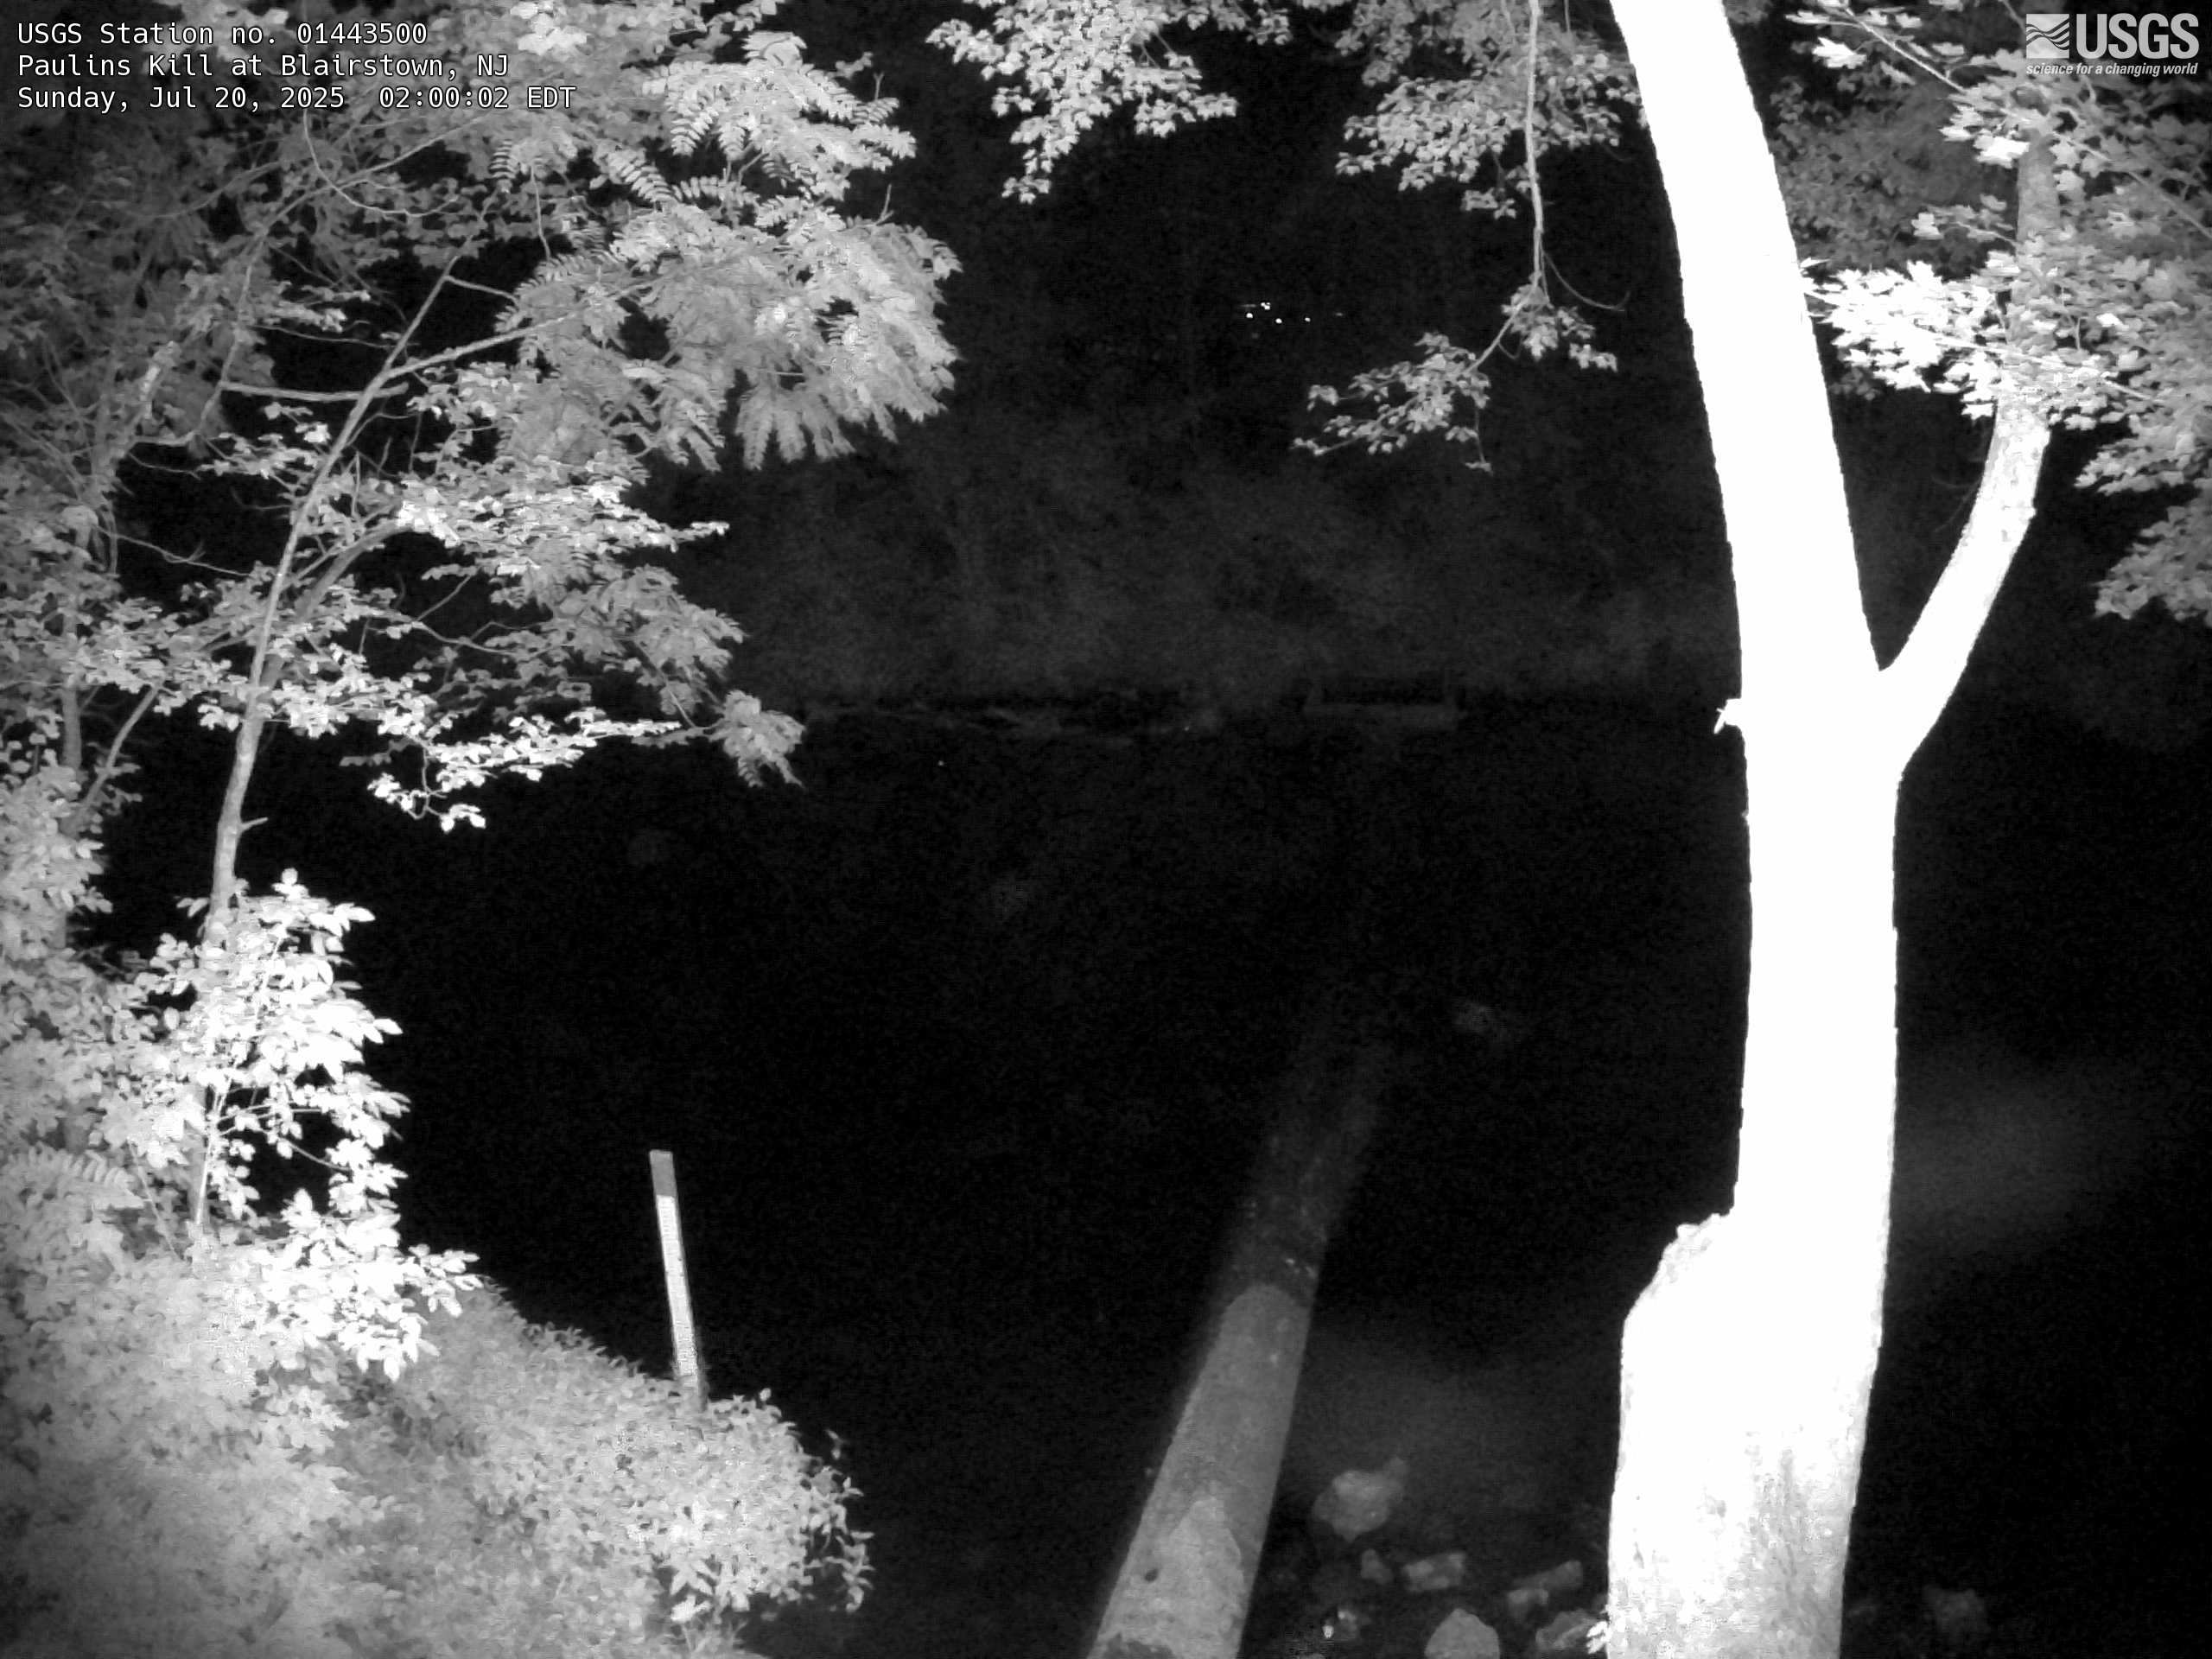
Streamgage 01443500 Paulins Kill at Blairstown, NJ
Streamgage 01443500 Paulins Kill at Blairstown, NJWebcam at USGS Streamgage 01443500 Paulins Kill at Blairstown, NJ
Streamgage 01443500 Paulins Kill at Blairstown, NJ
Streamgage 01443500 Paulins Kill at Blairstown, NJWebcam at USGS Streamgage 01443500 Paulins Kill at Blairstown, NJ
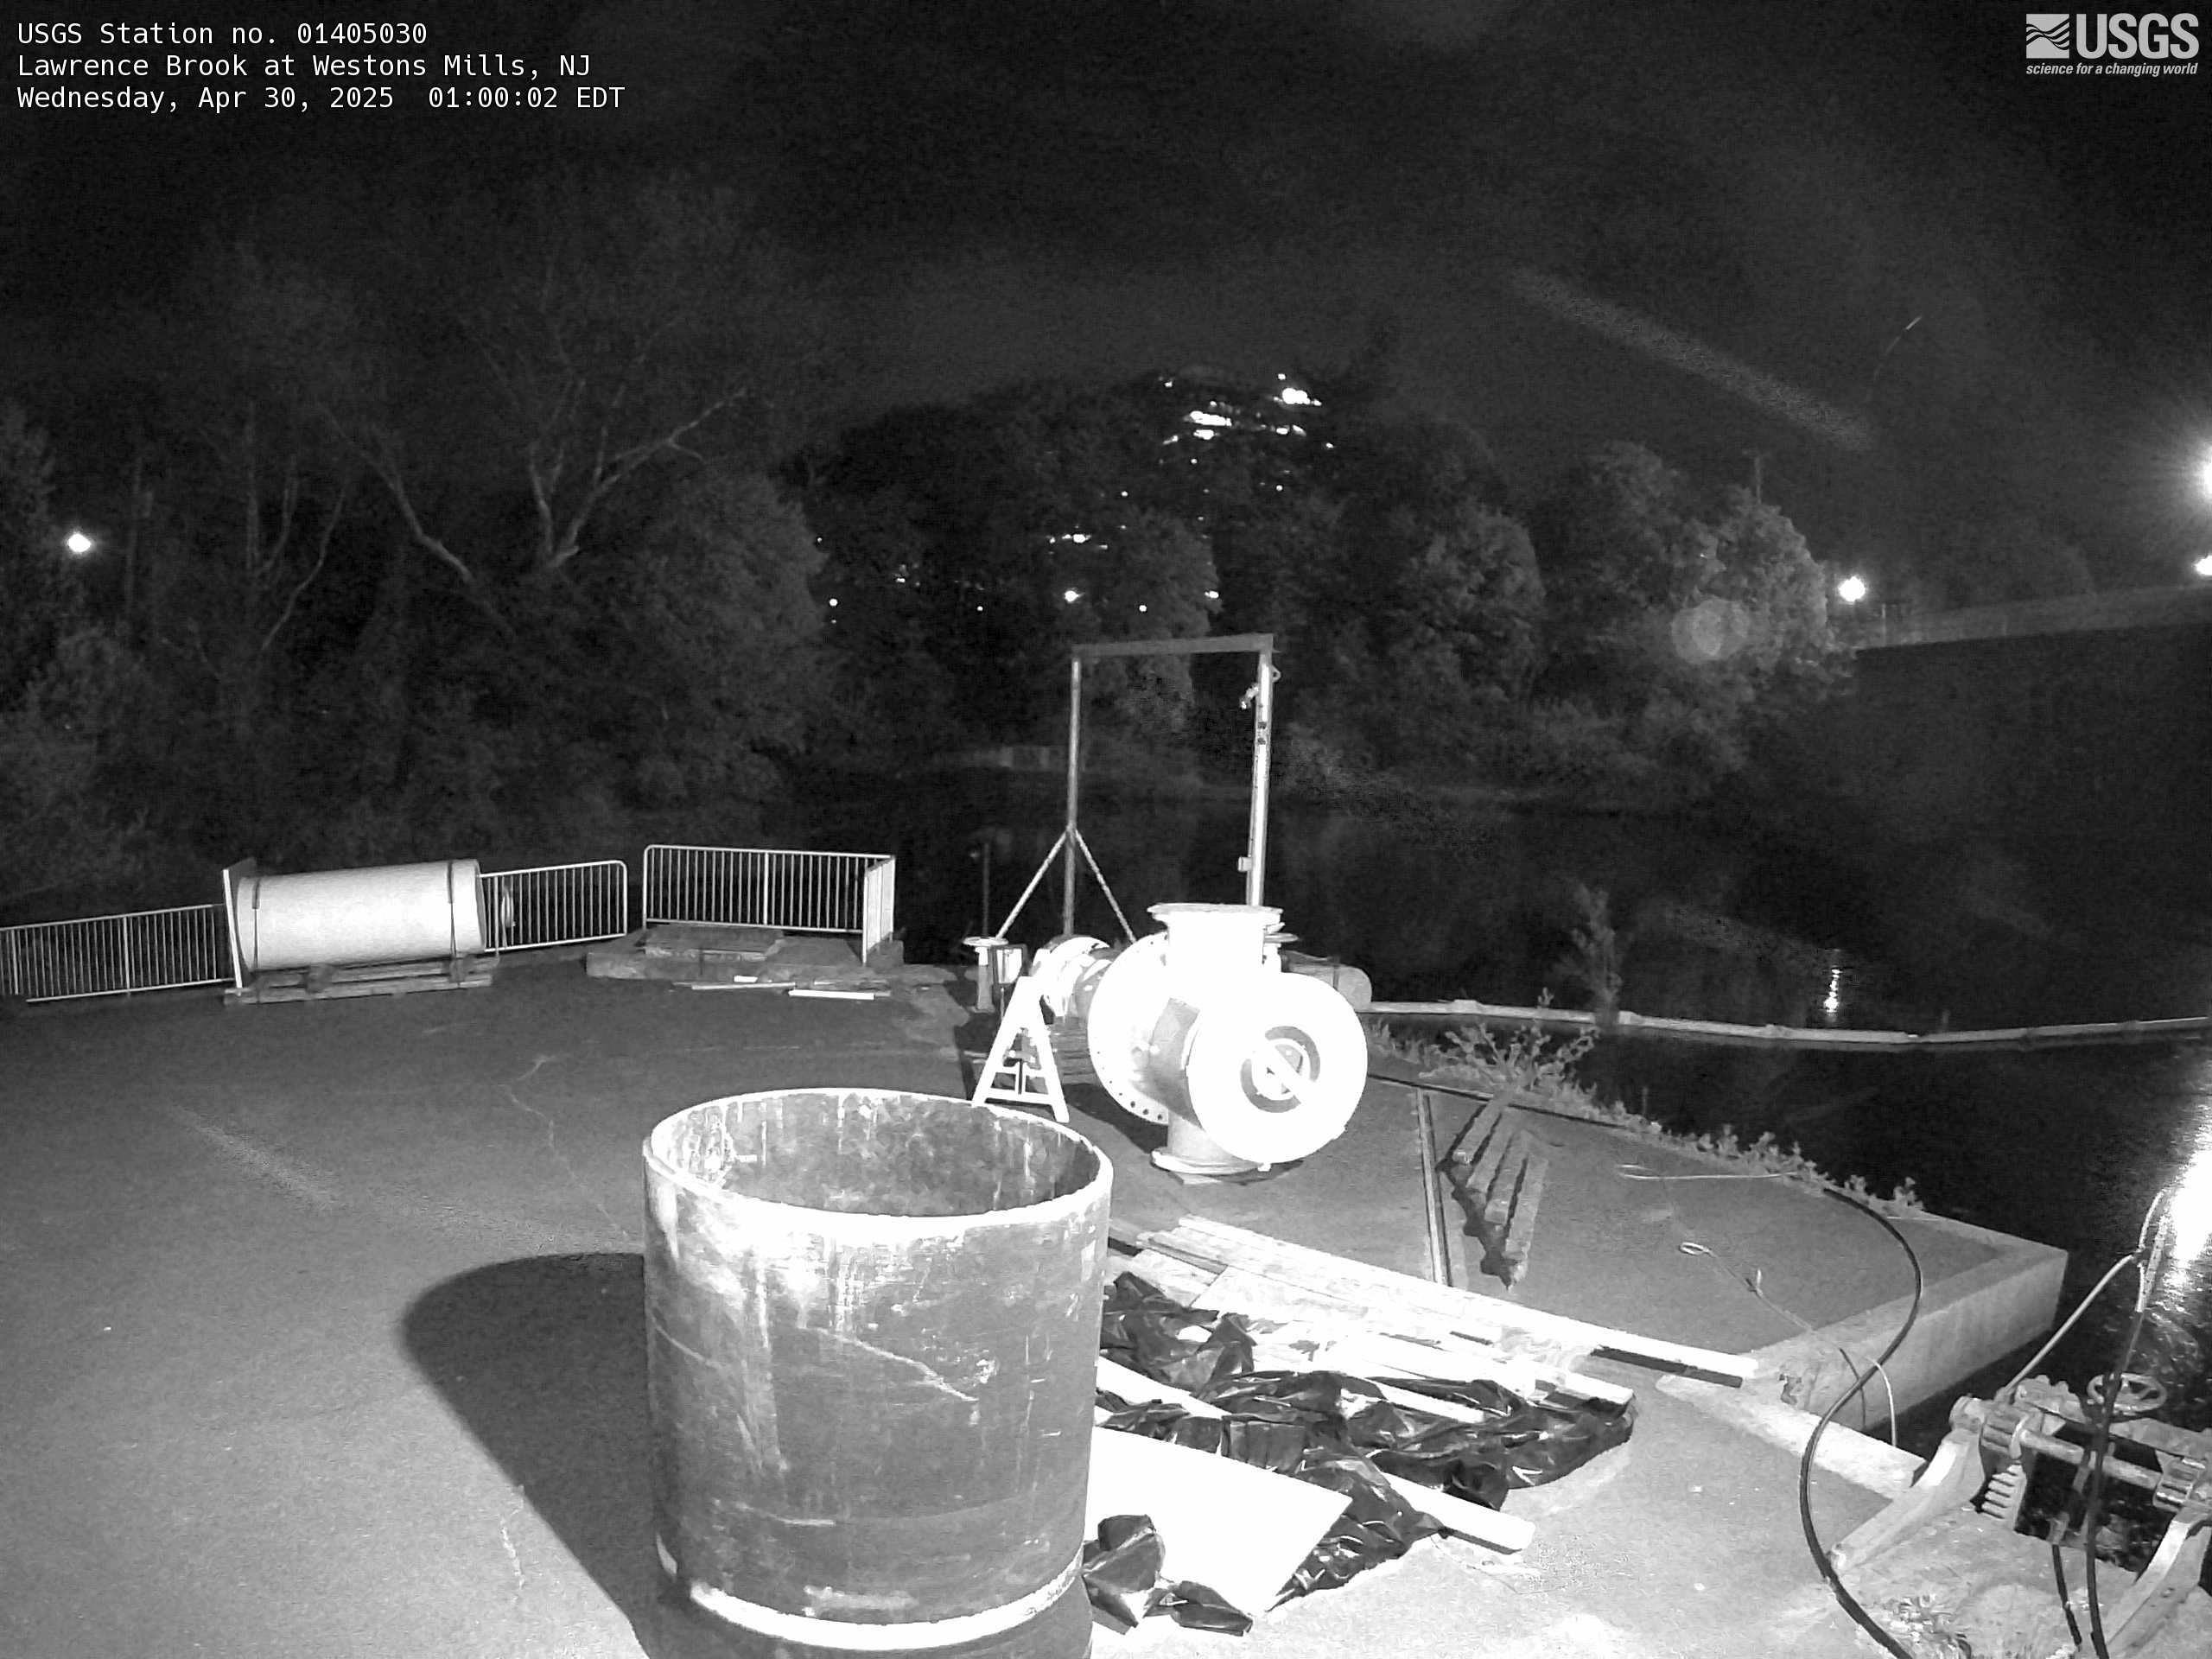
Streamgage 01405030 Lawrence Brook at Westons Mills, NJ
Streamgage 01405030 Lawrence Brook at Westons Mills, NJWebcam at USGS Streamgage 01405030 Lawrence Brook at Westons Mills, NJ
Streamgage 01405030 Lawrence Brook at Westons Mills, NJ
Streamgage 01405030 Lawrence Brook at Westons Mills, NJWebcam at USGS Streamgage 01405030 Lawrence Brook at Westons Mills, NJ

Streamgage 01463740 Shabakunk Creek at Sylva Lake Dam at Ewingville NJ
Streamgage 01463740 Shabakunk Creek at Sylva Lake Dam at Ewingville NJWebcam at USGS Streamgage 01463740 Shabakunk Creek at Sylva Lake Dam at Ewingville NJ
Streamgage 01463740 Shabakunk Creek at Sylva Lake Dam at Ewingville NJ
Streamgage 01463740 Shabakunk Creek at Sylva Lake Dam at Ewingville NJWebcam at USGS Streamgage 01463740 Shabakunk Creek at Sylva Lake Dam at Ewingville NJ
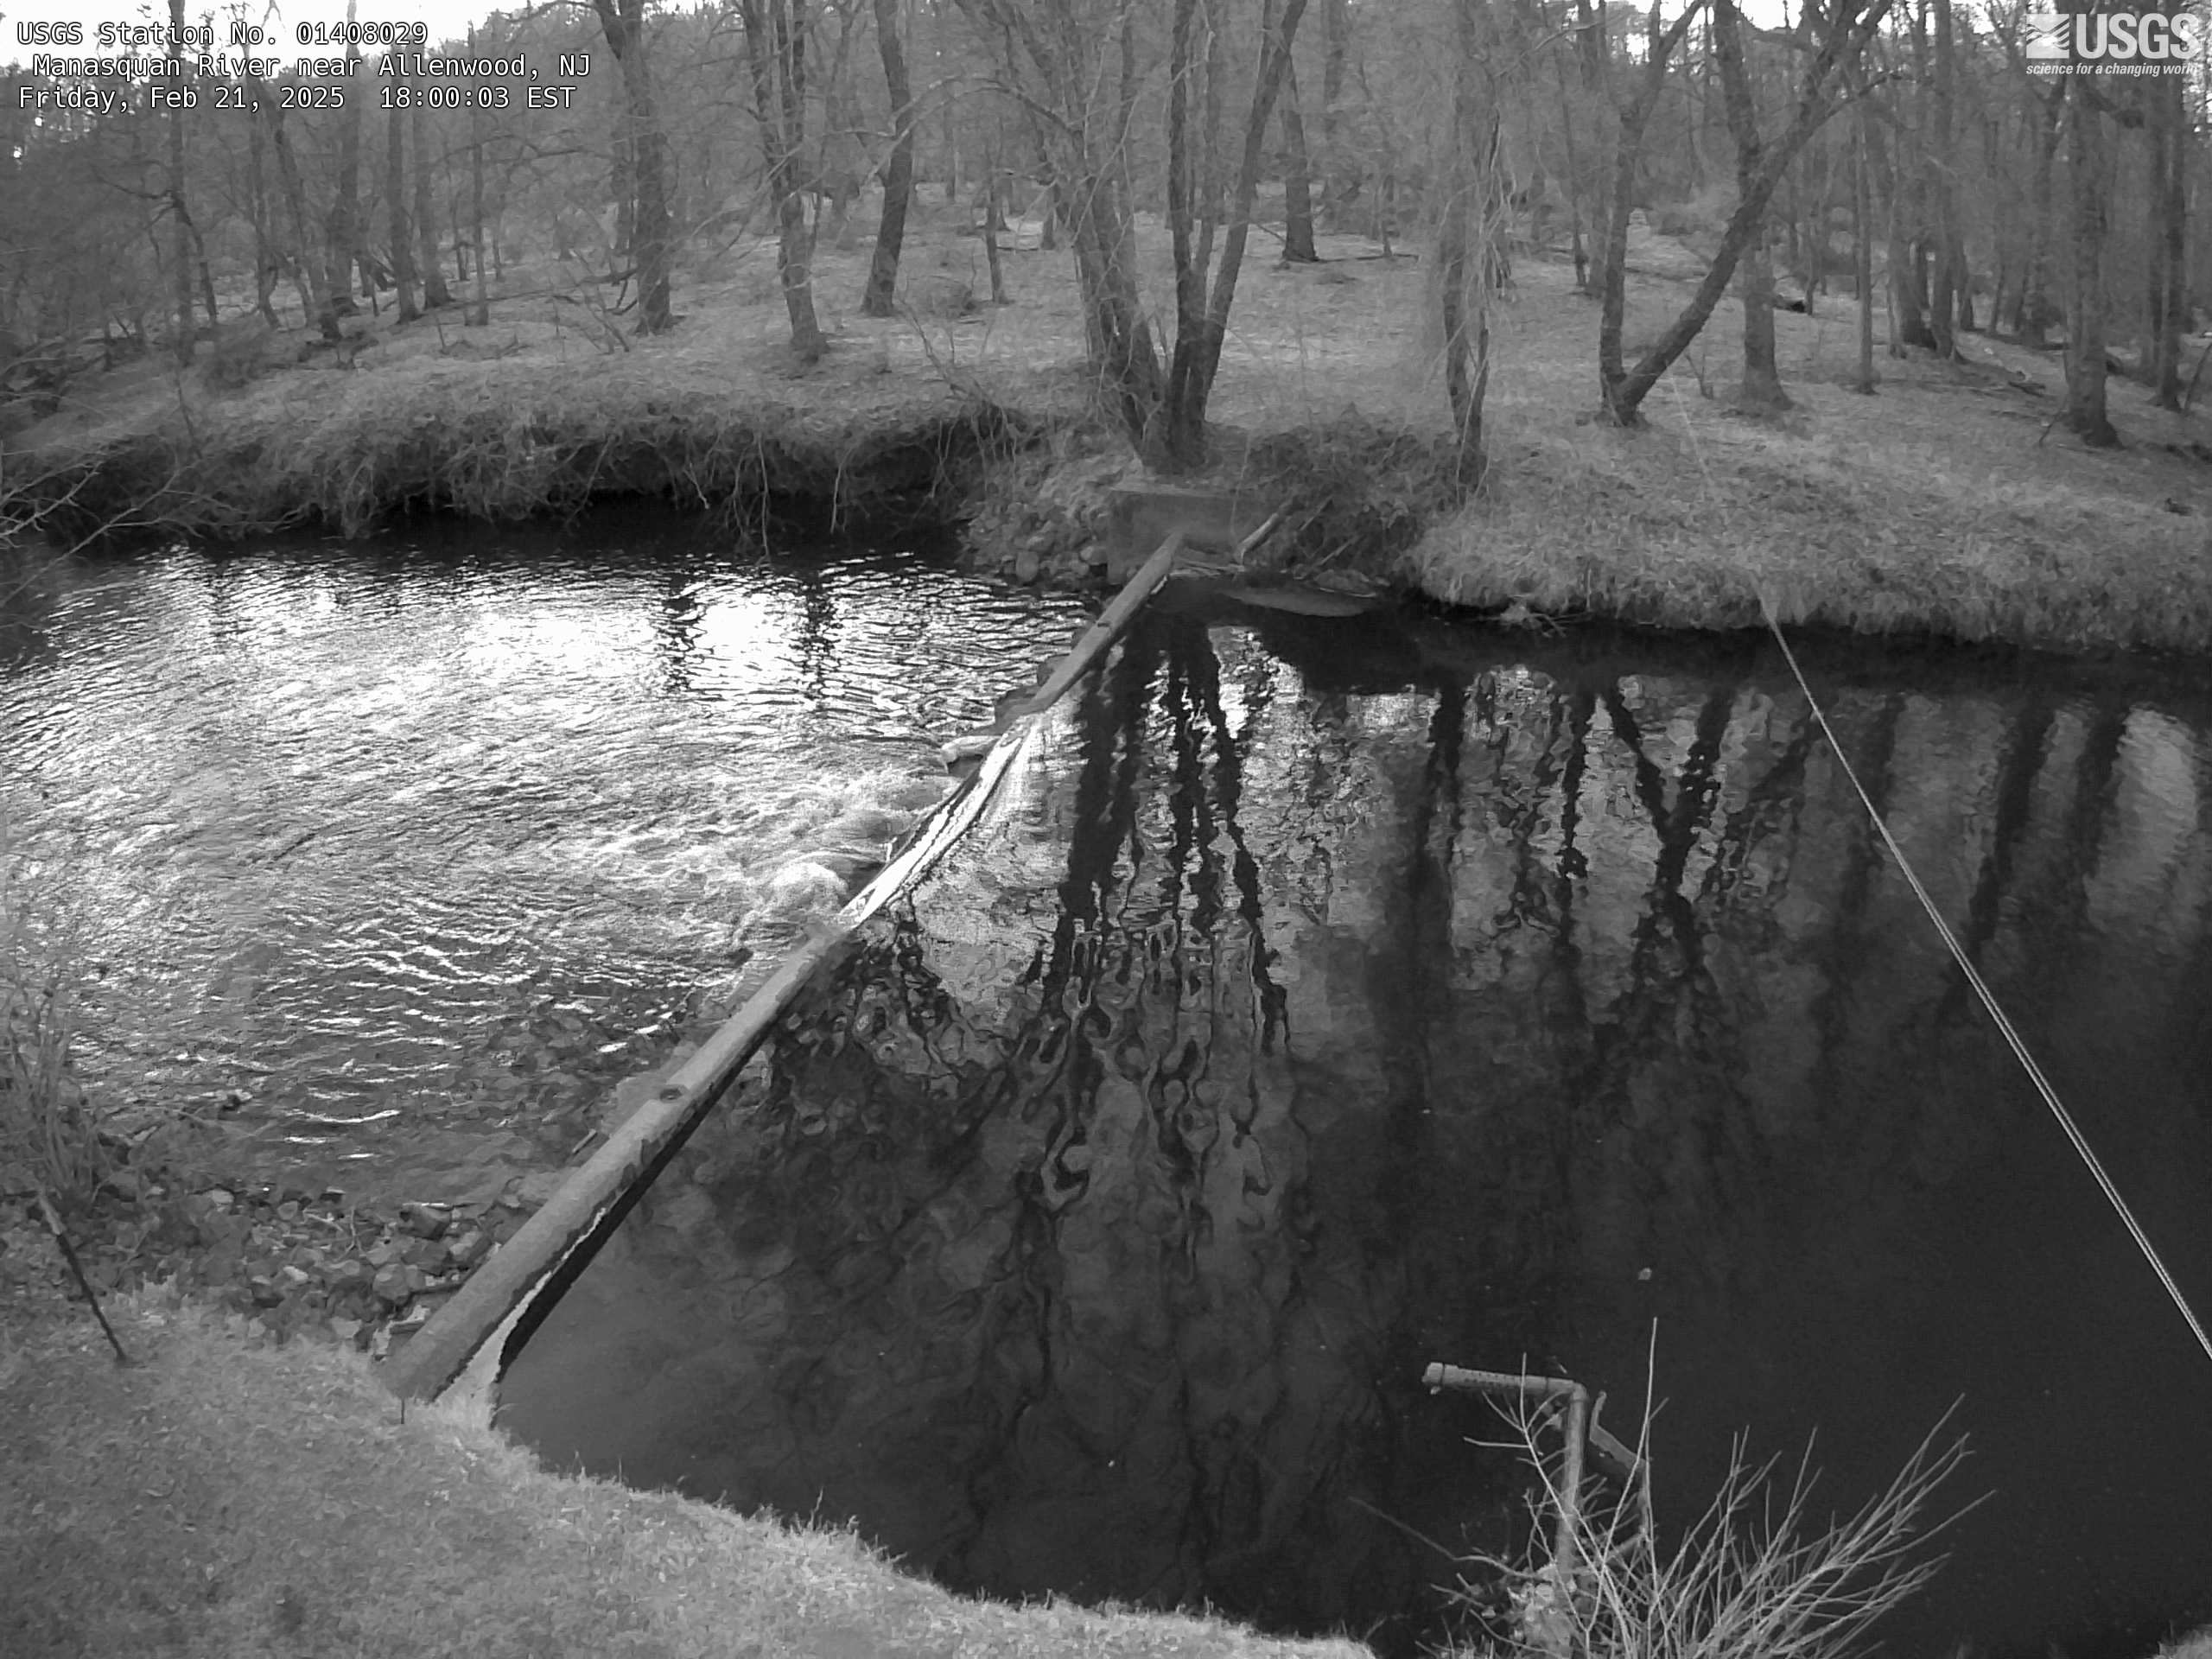
Streamgage 01408029 Manasquan River near Allenwood, NJ
Streamgage 01408029 Manasquan River near Allenwood, NJWebcam at USGS Streamgage 01408029 Manasquan River near Allenwood, NJ
Streamgage 01408029 Manasquan River near Allenwood, NJ
Streamgage 01408029 Manasquan River near Allenwood, NJWebcam at USGS Streamgage 01408029 Manasquan River near Allenwood, NJ