
A newly emerged adult wetsalts tiger beetle. Photo by Robert K. D. Peterson, 2017.
Images
Volcano Science Center images.
Filter Total Items: 564

Newly emerged adult wetsalts tiger beetle
A newly emerged adult wetsalts tiger beetle. Photo by Robert K. D. Peterson, 2017.

Panoramic photo of the West Yellowstone rhyolite lava flow
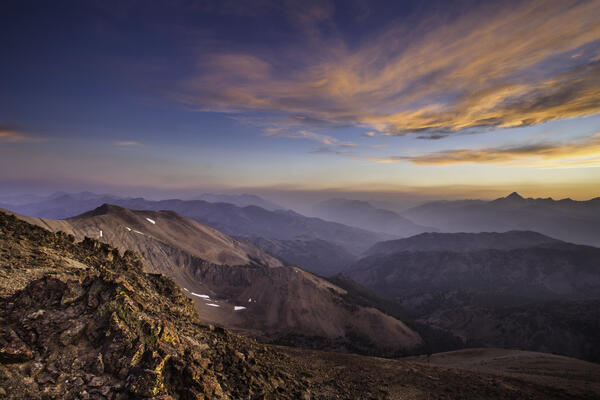
Panoramic photo of the West Yellowstone rhyolite lava flowPanoramic of the West Yellowstone rhyolite lava flow taken along Highway 20 (between the West entrance of Yellowstone National Park and Madison Junction). The flow is approximately 111,000 years old and has a volume of about 41 km3 (10 mi3).
Panoramic photo of the West Yellowstone rhyolite lava flow
Panoramic photo of the West Yellowstone rhyolite lava flowPanoramic of the West Yellowstone rhyolite lava flow taken along Highway 20 (between the West entrance of Yellowstone National Park and Madison Junction). The flow is approximately 111,000 years old and has a volume of about 41 km3 (10 mi3).

Big Southern Butte, a rhyolite dome located in the eastern Snake River Plain of Idaho
Big Southern Butte, a rhyolite dome located in the eastern Snake River Plain of IdahoBig Southern Butte, a rhyolite dome located in the eastern Snake River Plain of Idaho. Photo by Devin Englestead, BLM (https://flic.kr/p/VYMDKz).

A geologist examples a basaltic lava flow along the Madison River
A geologist examples a basaltic lava flow along the Madison RiverA geologist examples a basaltic lava flow along the Madison River, looking for an area that can yield samples suitable for 40Ar/39Ar geochronology. USGS photo by Jorge Vazquez, June 2017.
Jim McClure-Jerry Peak Wilderness area in central Idaho
Jim McClure-Jerry Peak Wilderness area in central IdahoThe geology of the Jim McClure-Jerry Peak Wilderness area in central Idaho includes the Challis volcanics, which erupted about 52–45 million years ago. Photo by Matt Liedecker, Bureau of Land Management, May 23, 2017 (https://www.flickr.com/photos/blmidaho/34808808006/).

Plowing operations in Yellowstone National Park
Plowing operations in Yellowstone National Park. Photo by Jake Frank, March 28, 2017.
Plowing operations in Yellowstone National Park. Photo by Jake Frank, March 28, 2017.

Allan Lerner
Allan Lerner works in the USGS volcanic gas geochemistry group. The photo was taken in the crater of Mount St. Helens, with Spirit Lake and Mount Rainier in the distance. USGS photo by P. Kelly.
Allan Lerner works in the USGS volcanic gas geochemistry group. The photo was taken in the crater of Mount St. Helens, with Spirit Lake and Mount Rainier in the distance. USGS photo by P. Kelly.
Mineral saturation versus temperature for a geothermal water sample from Surprise Valley, California
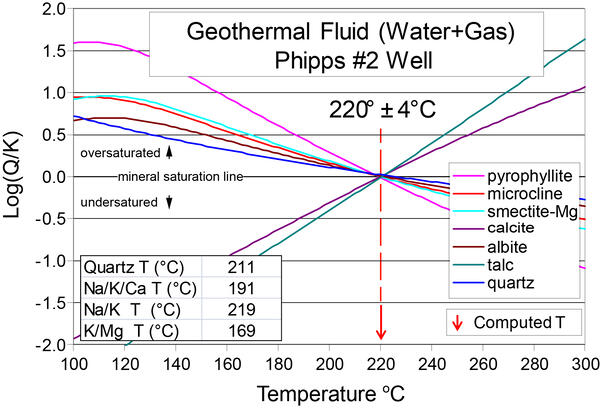
Mineral saturation versus temperature for a geothermal water sample from Surprise Valley, CaliforniaComputed mineral saturation indices (log(Q/K)) as a function of temperature for a geothermal water sample from Surprise Valley, California, after correction for CO2 loss due to degassing. Note that the mineral saturation points converge at 220 °C (428 °F) with a very small error of +/- 4 °C (7 °F).
Mineral saturation versus temperature for a geothermal water sample from Surprise Valley, California
Mineral saturation versus temperature for a geothermal water sample from Surprise Valley, CaliforniaComputed mineral saturation indices (log(Q/K)) as a function of temperature for a geothermal water sample from Surprise Valley, California, after correction for CO2 loss due to degassing. Note that the mineral saturation points converge at 220 °C (428 °F) with a very small error of +/- 4 °C (7 °F).

Helicopter carrying geophysical sensors above Yellowstone National Park
Helicopter carrying geophysical sensors above Yellowstone National ParkHelicopter with airborne electromagnetics sensors dangling beneath as it flies over a portion of Yellowstone National Park. Photo by Jeff Hungerford, November 2016.

Kullenberg coring platform from the University of Minnesota-Twin Cities Continental Scientific Drilling facility
Kullenberg coring platform from the University of Minnesota-Twin Cities Continental Scientific Drilling facilityKullenberg coring platform from the University of Minnesota-Twin Cities Continental Scientific Drilling facility used to collect long (up to 12 m, or 40 feet) sediment cores from Yellowstone Lake. Photo taken in September 2016 by Lisa Morgan.

Cut polycarbonate sections of sediment core from Yellowstone Lake
Cut polycarbonate sections of sediment core from Yellowstone LakeCut polycarbonate sections of sediment core collected from core YL16-3A from the Deep Hole, the deepest part of Yellowstone Lake at about 119 m (390 feet) depth, southeast of Stevenson Island. Photo taken in September 2016 by Lisa Morgan.

Beartooth Mountains looking west northwest from near Beartooth Pass
Beartooth Mountains looking west northwest from near Beartooth PassBeartooth Mountains looking west northwest from near Beartooth Pass, Wyoming. Photo by Jeff Havig, University of Minnesota, July 20, 2016.
Beartooth Mountains looking west northwest from near Beartooth Pass
Beartooth Mountains looking west northwest from near Beartooth PassBeartooth Mountains looking west northwest from near Beartooth Pass, Wyoming. Photo by Jeff Havig, University of Minnesota, July 20, 2016.
Schematic cartoon showing internal structure of a rhyolite lava flow
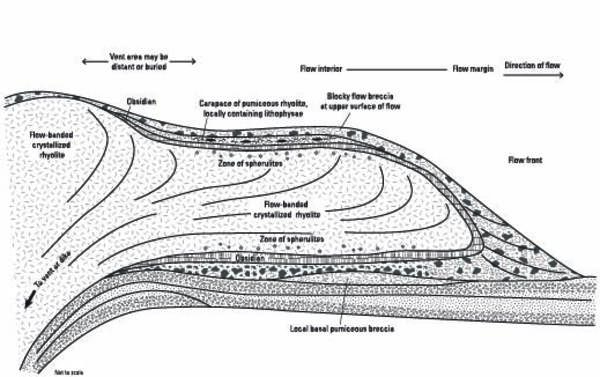
Schematic cartoon showing internal structure of a rhyolite lava flowSchematic cartoon of an idealized rhyolite lava flow with structures identified. Figure modified from Sweetkind et al. (2015) [https://dx.doi.org/10.3133/sir20155022].
Schematic cartoon showing internal structure of a rhyolite lava flow
Schematic cartoon showing internal structure of a rhyolite lava flowSchematic cartoon of an idealized rhyolite lava flow with structures identified. Figure modified from Sweetkind et al. (2015) [https://dx.doi.org/10.3133/sir20155022].

Aerial thermal infrared images of Yellowstone National Park from the 2000s
Aerial thermal infrared images of Yellowstone National Park from the 2000sTop: Thermographic mosaic of Yellowstone acquired by the NASA’s MODIS-ASTER Airborne Simulator (MASTER), a thermal infrared scanner, in September 2006. Dark shades indicate cool temperatures and bright are warm; this reflects not only hydrothermal activity, but also types of ground cover.

Data from GPS station AB53 near the peak of a mountain on Mitkof Island, Alaska, including measured snow depth
Data from GPS station AB53 near the peak of a mountain on Mitkof Island, Alaska, including measured snow depthData from GPS station AB53 near the peak of a mountain on Mitkof Island, Alaska, including measured snow depth down at the base of the mountain. Notice how the North (top), east (second from the top), and vertical (third from the top) positions are impacted by the presence of snow. This is an extreme example of the influence of snow on GPS data.

Map of the Heart Mountain slide block
Map of the Heart Mountain slide block. From Mitchell et al., 2015 ("Catastrophic emplacement of giant landslides aided by thermal decomposition: Heart Mountain, Wyoming." Earth and Planetary Science Letters 411: 199-207), modified from Anders et al. (2010).
Map of the Heart Mountain slide block. From Mitchell et al., 2015 ("Catastrophic emplacement of giant landslides aided by thermal decomposition: Heart Mountain, Wyoming." Earth and Planetary Science Letters 411: 199-207), modified from Anders et al. (2010).

Big Southern Butte, Idaho
Big Southern Butte, Idaho. The butte is among the largest rhyolite domes in the world and is located in the eastern Snake River Plain. Photo by James Neeley, BLM (https://flic.kr/p/CsA4TV).
Big Southern Butte, Idaho. The butte is among the largest rhyolite domes in the world and is located in the eastern Snake River Plain. Photo by James Neeley, BLM (https://flic.kr/p/CsA4TV).

Lidar coverage of the Hebgen and Red Canyon faults collected in 2014
Lidar coverage of the Hebgen and Red Canyon faults collected in 2014Lidar coverage of the Hebgen and Red Canyon faults collected in 2014. Magenta lines show fault scarps mapped by USGS geologists shortly after the 1959 earthquake. Yellow lines show fault scarps interpreted from lidar data 55 years after the earthquake.

Lava Mountain, Wyoming
Lava Mountain, Wyoming. (A) View from Dubois, WY, in the Wind River basin looking northwest ~30 km toward Lava Mountain.
Lava Mountain, Wyoming. (A) View from Dubois, WY, in the Wind River basin looking northwest ~30 km toward Lava Mountain.

Schematic cross section of the magmatic and hydrothermal systems underlying Yellowstone Caldera
Schematic cross section of the magmatic and hydrothermal systems underlying Yellowstone CalderaSchematic cross section of the magmatic and hydrothermal systems underlying Yellowstone Caldera, showing magmatic volatiles emitted during crystallization of the rhyolitic magma and/or from basalt intrusions or convection, and the hypothesized relation with earthquake swarms on the caldera margins. The exsolved fluids accumulate at lithostatic pressures in the

Frosted trees in the Fairy Falls area of Yellowstone National Park near the Firehole River
Frosted trees in the Fairy Falls area of Yellowstone National Park near the Firehole RiverFrosted trees in the Fairy Falls area of Yellowstone National Park near the Firehole River. National Park Service photo by Annie Carlson, 2014.