
A magnitude 7.0 earthquake ruptured the Mendocino Transform Fault offshore Northern California on December 5, 2024. The USGS and colleagues from the Woods Hole Oceanographic Institution’s Ocean Bottom Seismic Instrument Center deployed our new fleet of rapid response ocean bottom seismographs just 11 days later—the fastest response in U.S. history.
Images
Woods Hole Coastal and Marine Science Center images
Filter Total Items: 1298

Mendocino RROBS Retrieval
A magnitude 7.0 earthquake ruptured the Mendocino Transform Fault offshore Northern California on December 5, 2024. The USGS and colleagues from the Woods Hole Oceanographic Institution’s Ocean Bottom Seismic Instrument Center deployed our new fleet of rapid response ocean bottom seismographs just 11 days later—the fastest response in U.S. history.
A magnitude 7.0 earthquake ruptured the Mendocino Transform Fault offshore Northern California on December 5, 2024. The USGS and colleagues from the Woods Hole Oceanographic Institution’s Ocean Bottom Seismic Instrument Center deployed our new fleet of rapid response ocean bottom seismographs just 11 days later—the fastest response in U.S. history.
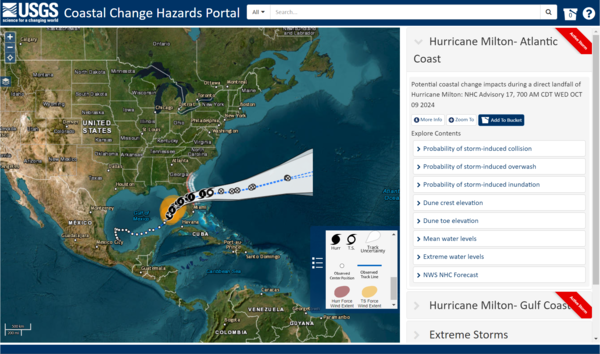
CCH Portal - Hurricane Milton
Coastal Change Hazards Portal showing the trajectory of Hurricane Milton and the various data users could explore on the map.
Coastal Change Hazards Portal showing the trajectory of Hurricane Milton and the various data users could explore on the map.
Rapid Response OBS - Mendocino
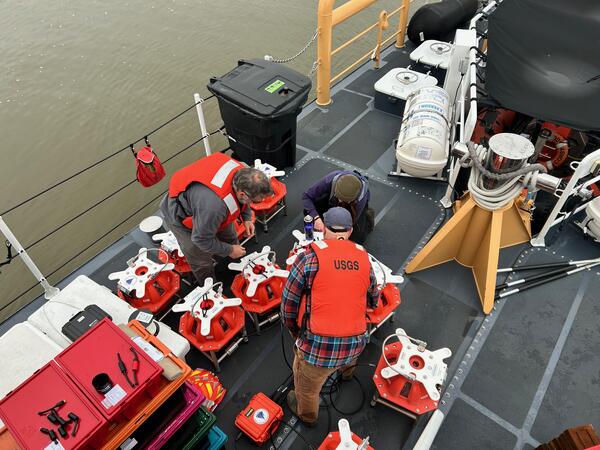
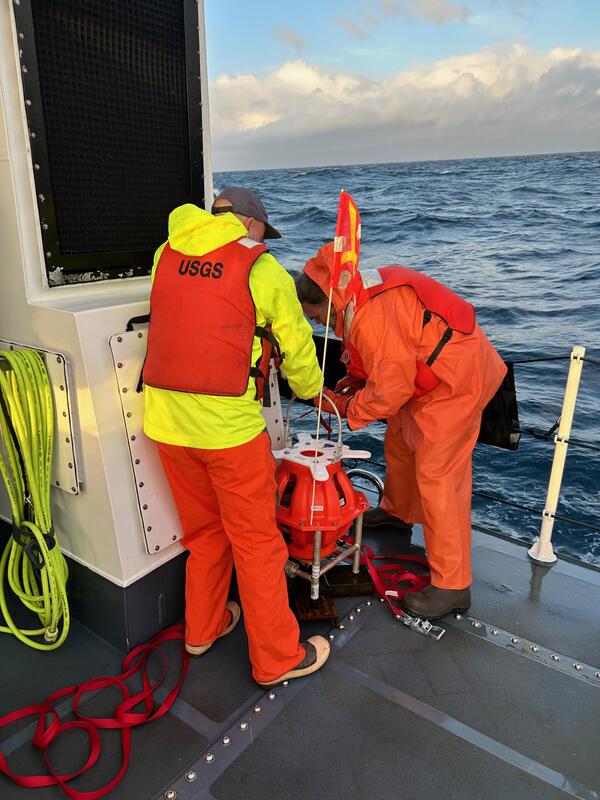
Wayne Baldwin (USGS), Eric Moore (USGS), and Hannah Brewer (Woods Hole Oceanographic Institution) preparing the rapid response ocean bottom seismograph fleet for deployment. Photo credit: Nathan Miller, USGS Woods Hole Coastal and Marine Science Center.
Wayne Baldwin (USGS), Eric Moore (USGS), and Hannah Brewer (Woods Hole Oceanographic Institution) preparing the rapid response ocean bottom seismograph fleet for deployment. Photo credit: Nathan Miller, USGS Woods Hole Coastal and Marine Science Center.
Rapid Response OBS - Mendocino
Wayne Baldwin (USGS), Eric Moore (USGS), and Hannah Brewer (Woods Hole Oceanographic Institution) preparing the rapid response ocean bottom seismograph fleet for deployment. Photo credit: Nathan Miller, USGS Woods Hole Coastal and Marine Science Center.
Wayne Baldwin (USGS), Eric Moore (USGS), and Hannah Brewer (Woods Hole Oceanographic Institution) preparing the rapid response ocean bottom seismograph fleet for deployment. Photo credit: Nathan Miller, USGS Woods Hole Coastal and Marine Science Center.
Rapid Response OBS - Mendocino
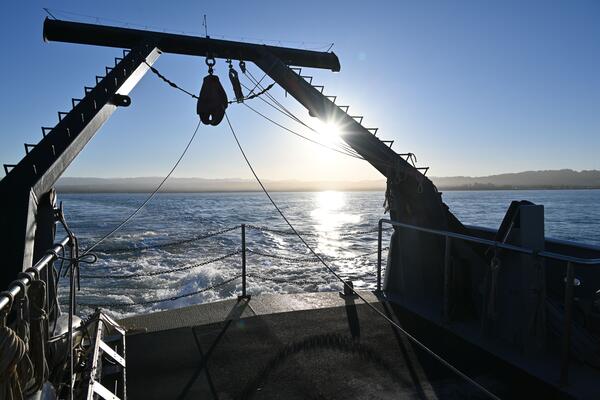
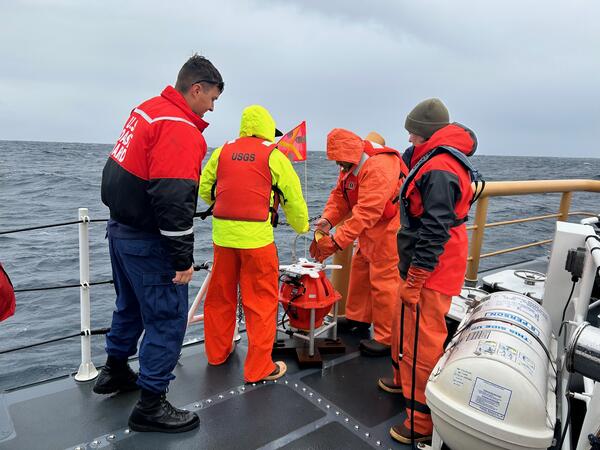
Wayne Baldwin (USGS), Eric Moore (USGS), and Hannah Brewer (Woods Hole Oceanographic Institution) about to deploy one of the rapid response ocean bottom seismograph fleet. Photo credit: Nathan Miller, USGS Woods Hole Coastal and Marine Science Center.
Wayne Baldwin (USGS), Eric Moore (USGS), and Hannah Brewer (Woods Hole Oceanographic Institution) about to deploy one of the rapid response ocean bottom seismograph fleet. Photo credit: Nathan Miller, USGS Woods Hole Coastal and Marine Science Center.
Rapid Response OBS - Mendocino
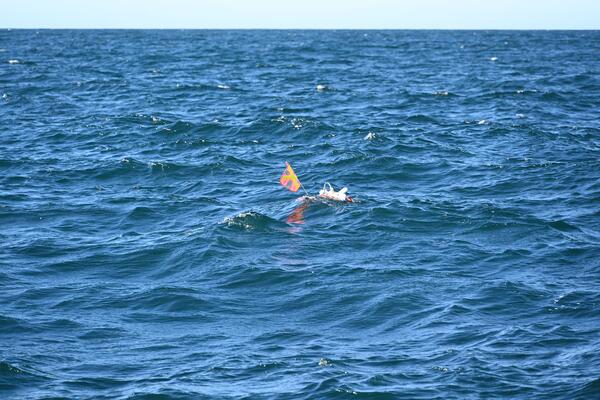
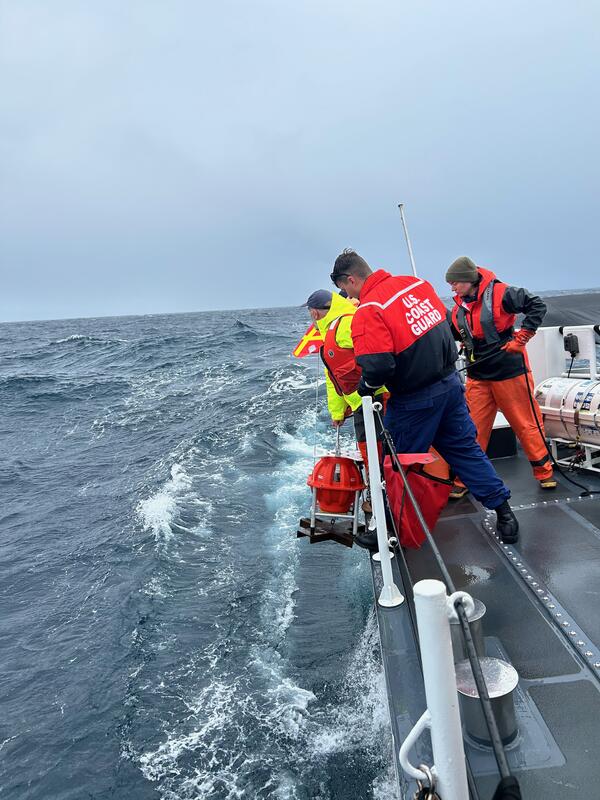
Eric Moore (USGS) deploying one of the rapid response ocean bottom seismographs. Photo credit: Nathan Miller, USGS Woods Hole Coastal and Marine Science Center.
Eric Moore (USGS) deploying one of the rapid response ocean bottom seismographs. Photo credit: Nathan Miller, USGS Woods Hole Coastal and Marine Science Center.
Rapid Response OBS - Mendocino
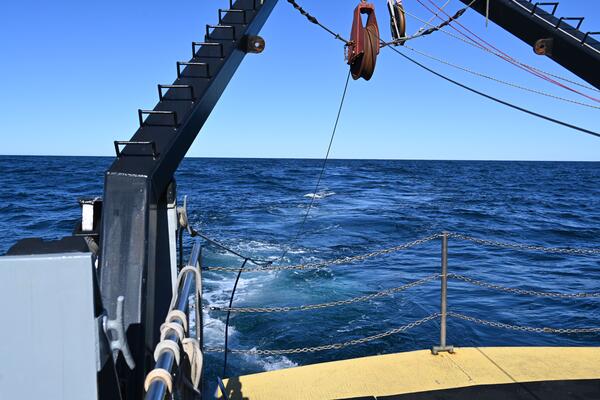
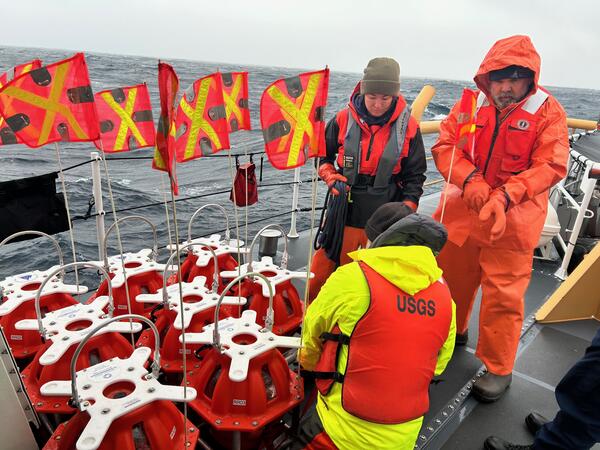
Wayne Baldwin (USGS) and Eric Moore (USGS) preparing the rapid response ocean bottom seismograph fleet for deployment. Photo credit: Nathan Miller, USGS Woods Hole Coastal and Marine Science Center.
Wayne Baldwin (USGS) and Eric Moore (USGS) preparing the rapid response ocean bottom seismograph fleet for deployment. Photo credit: Nathan Miller, USGS Woods Hole Coastal and Marine Science Center.

Rapid Response OBS - Mendocino
Wayne Baldwin (USGS) and Eric Moore (USGS) preparing the rapid response ocean bottom seismograph fleet for deployment. Photo credit: Nathan Miller, USGS Woods Hole Coastal and Marine Science Center.
Wayne Baldwin (USGS) and Eric Moore (USGS) preparing the rapid response ocean bottom seismograph fleet for deployment. Photo credit: Nathan Miller, USGS Woods Hole Coastal and Marine Science Center.

NOPP Hurricane Coastal Impacts Geonarrative
As powerful hurricanes approach the coast, they generate elevated water levels and dangerous wave conditions that can cause extensive flooding, significant landscape changes, and destruction of property.
As powerful hurricanes approach the coast, they generate elevated water levels and dangerous wave conditions that can cause extensive flooding, significant landscape changes, and destruction of property.

Coastcams Map with Coverage
An illustrated map of the United States and territories, displaying the site coverage of the Coastcam cameras that survey the coasts and provide imagery, with purple diamonds at these locations along the West and East Coast, Alaska and Puerto Rico.
An illustrated map of the United States and territories, displaying the site coverage of the Coastcam cameras that survey the coasts and provide imagery, with purple diamonds at these locations along the West and East Coast, Alaska and Puerto Rico.
Flood Event Viewer Map Coverage
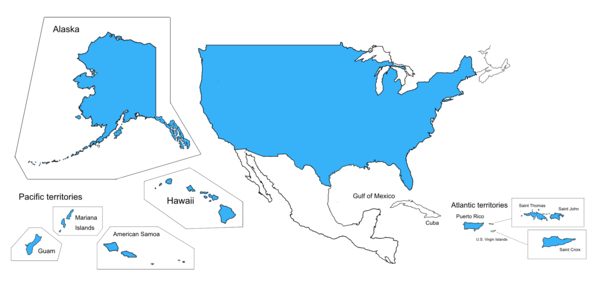
An illustrated map displaying the Flood Event Viewer national coverage, in blue, across the United States (East and West Coast), Alaska, Hawaii, and Pacific (Guam, American Samoa, Mariana Islands) and Atlantic territories (Puerto Rico, U.S. Virgin Islands)
An illustrated map displaying the Flood Event Viewer national coverage, in blue, across the United States (East and West Coast), Alaska, Hawaii, and Pacific (Guam, American Samoa, Mariana Islands) and Atlantic territories (Puerto Rico, U.S. Virgin Islands)
Coastal Change Hazard Portal Map Coverage
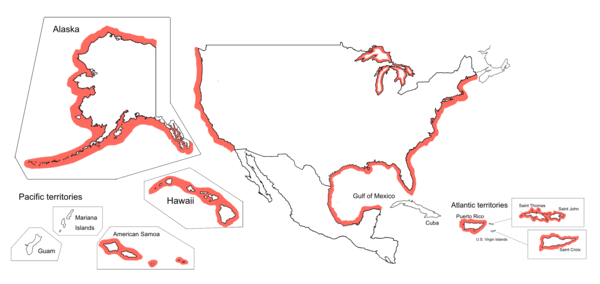
Illustrated map displaying the coverage provided by the Coastal Change Hazard Portal for the U.S. East and West Coast, Great Lakes, Gulf of America, Hawaii, Alaska and Atlantic Territories (Puerto Rico and U.S. Virgin Islands) in red along the coasts to show the prediction output from CCHP.
Illustrated map displaying the coverage provided by the Coastal Change Hazard Portal for the U.S. East and West Coast, Great Lakes, Gulf of America, Hawaii, Alaska and Atlantic Territories (Puerto Rico and U.S. Virgin Islands) in red along the coasts to show the prediction output from CCHP.
COAWST Map Coverage
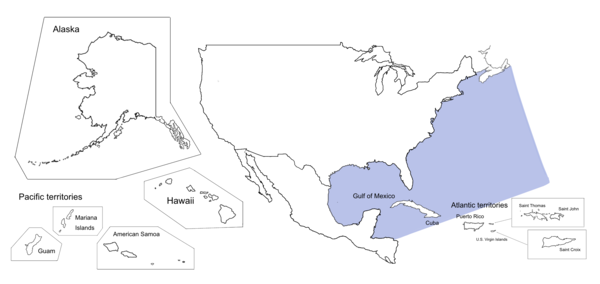
An illustrated map displaying the COAWST Modeling System product coverage for U.S. East Coast and the Gulf of America.
An illustrated map displaying the COAWST Modeling System product coverage for U.S. East Coast and the Gulf of America.