U.S. flag

An official website of the United States government

Images

Woods Hole Coastal and Marine Science Center images

Filter Total Items: 1357
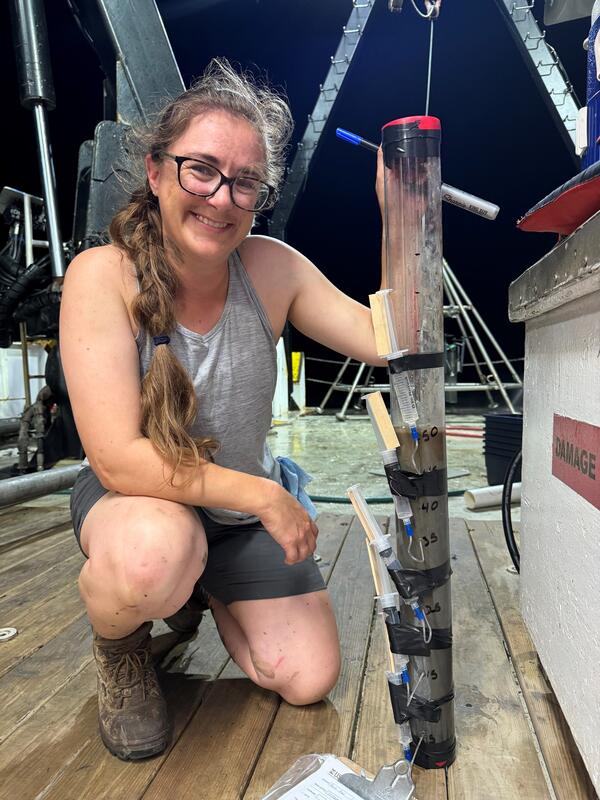
Person kneeling next to core sample on deck of ship at night
MRDF Coring
MRDF Coring
MRDF Coring

The USGS has a long history of studying seafloor instability in the Mississippi River Delta Front, beginning in the 1970s. 

As part of the OASIS project, we play a leading role in seafloor mapping, geophysical imaging, and interpreting the processes that shape this important region. 
The USGS has a long history of studying seafloor instability in the Mississippi River Delta Front, beginning in the 1970s. 

As part of the OASIS project, we play a leading role in seafloor mapping, geophysical imaging, and interpreting the processes that shape this important region. 
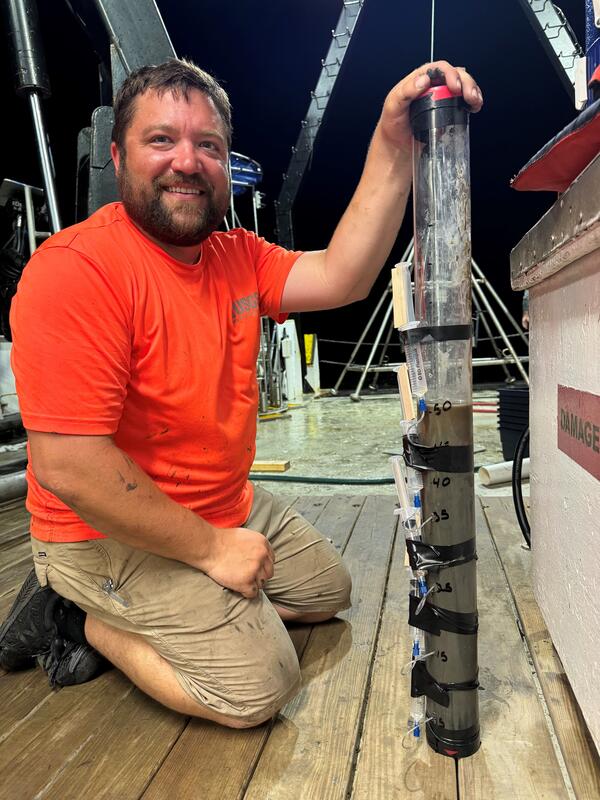
man kneeling on deck of ship next to a core sample at night
MRDF Mega Multi Coring

The USGS has a long history of studying seafloor instability in the Mississippi River Delta Front, beginning in the 1970s. 

As part of the OASIS project, we play a leading role in seafloor mapping, geophysical imaging, and interpreting the processes that shape this important region. 
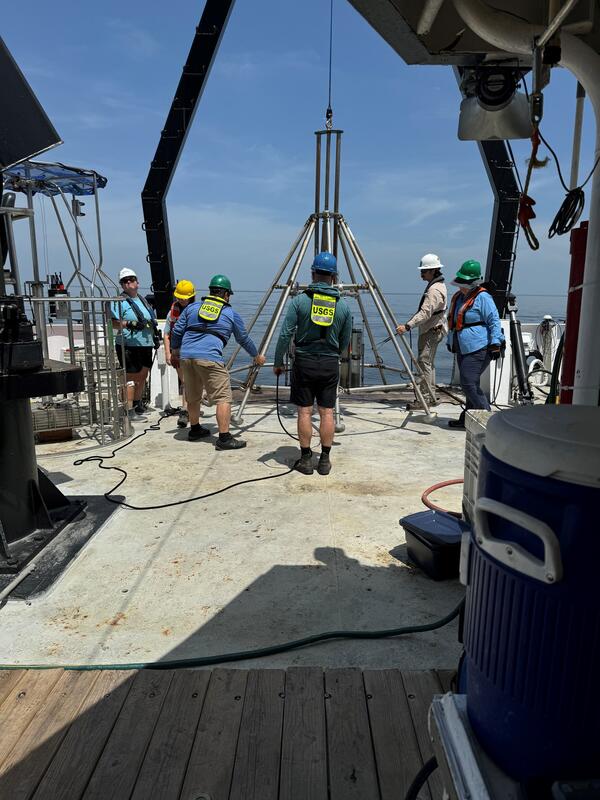
The USGS has a long history of studying seafloor instability in the Mississippi River Delta Front, beginning in the 1970s. 

As part of the OASIS project, we play a leading role in seafloor mapping, geophysical imaging, and interpreting the processes that shape this important region. 
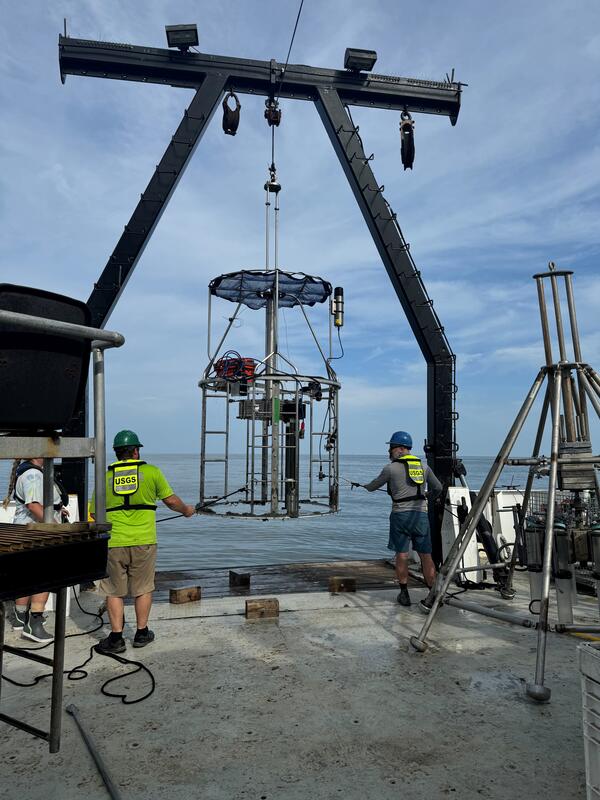
Three people on deck of ship working with mega multicorer
MRDF Coring
MRDF Coring
MRDF Coring

The USGS has a long history of studying seafloor instability in the Mississippi River Delta Front, beginning in the 1970s. 

As part of the OASIS project, we play a leading role in seafloor mapping, geophysical imaging, and interpreting the processes that shape this important region. 
The USGS has a long history of studying seafloor instability in the Mississippi River Delta Front, beginning in the 1970s. 

As part of the OASIS project, we play a leading role in seafloor mapping, geophysical imaging, and interpreting the processes that shape this important region. 
People on deck of ship working with mega multicorer
MFDF Coring
MFDF Coring
MFDF Coring

The USGS has a long history of studying seafloor instability in the Mississippi River Delta Front, beginning in the 1970s. 

As part of the OASIS project, we play a leading role in seafloor mapping, geophysical imaging, and interpreting the processes that shape this important region. 
The USGS has a long history of studying seafloor instability in the Mississippi River Delta Front, beginning in the 1970s. 

As part of the OASIS project, we play a leading role in seafloor mapping, geophysical imaging, and interpreting the processes that shape this important region. 
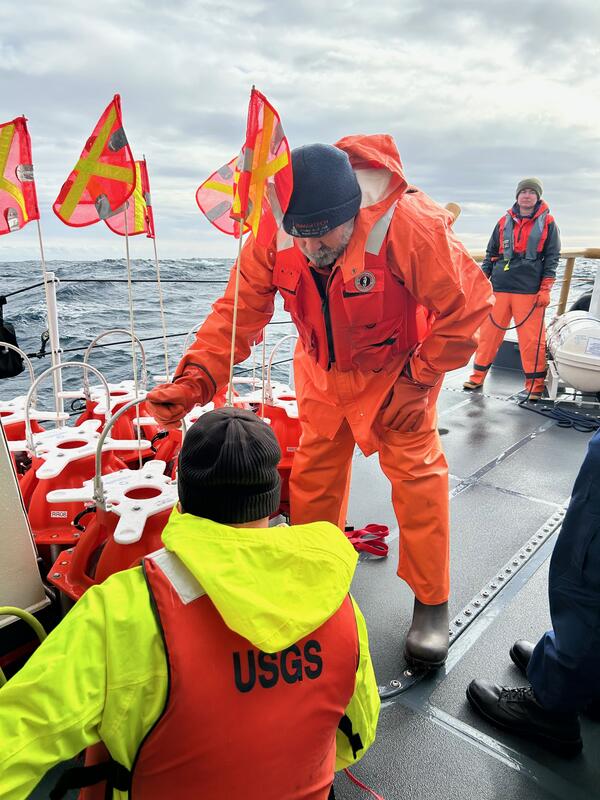
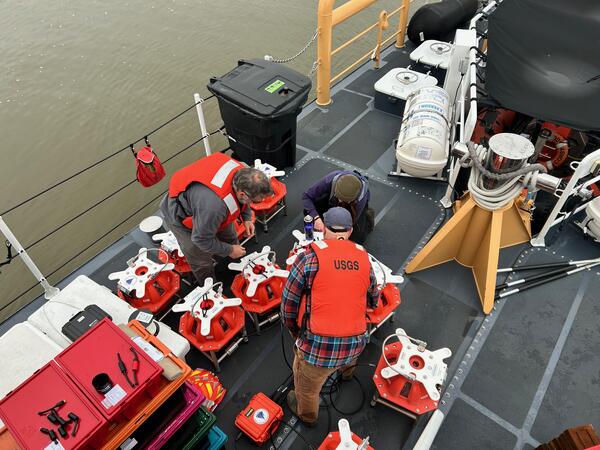
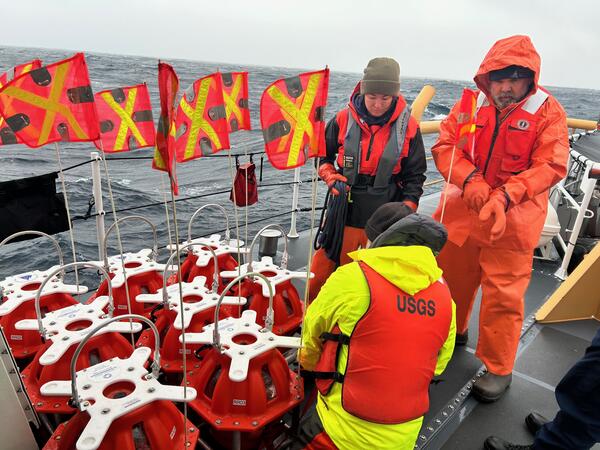
Three people on ship working on multiple pieces of equipment
Rapid Response OBS - Mendocino

Wayne Baldwin (USGS), Eric Moore (USGS), and Hannah Brewer (Woods Hole Oceanographic Institution) preparing the rapid response ocean bottom seismograph fleet for deployment. Photo credit: Nathan Miller, USGS Woods Hole Coastal and Marine Science Center. 

Wayne Baldwin (USGS), Eric Moore (USGS), and Hannah Brewer (Woods Hole Oceanographic Institution) preparing the rapid response ocean bottom seismograph fleet for deployment. Photo credit: Nathan Miller, USGS Woods Hole Coastal and Marine Science Center. 

Three people on ship working on multiple pieces of equipment
Rapid Response OBS - Mendocino

Wayne Baldwin (USGS), Eric Moore (USGS), and Hannah Brewer (Woods Hole Oceanographic Institution) preparing the rapid response ocean bottom seismograph fleet for deployment. Photo credit: Nathan Miller, USGS Woods Hole Coastal and Marine Science Center. 

Wayne Baldwin (USGS), Eric Moore (USGS), and Hannah Brewer (Woods Hole Oceanographic Institution) preparing the rapid response ocean bottom seismograph fleet for deployment. Photo credit: Nathan Miller, USGS Woods Hole Coastal and Marine Science Center. 

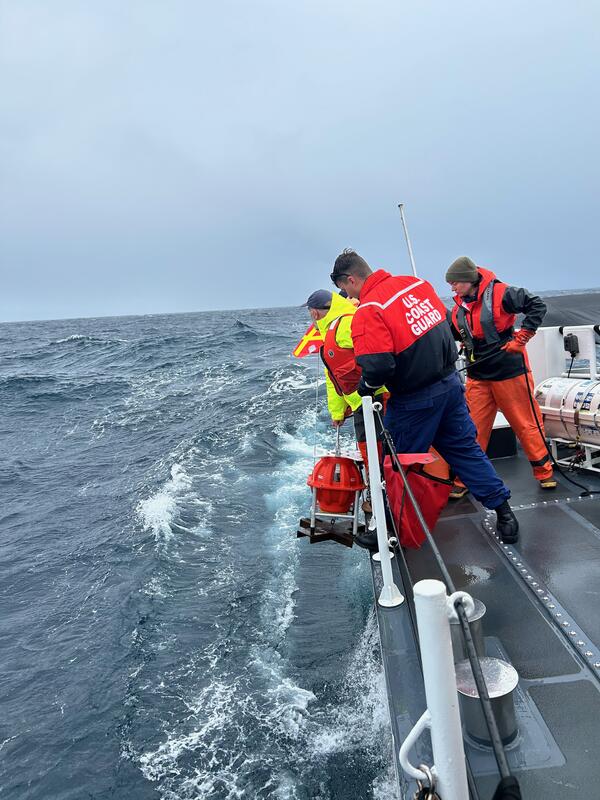
People leaning over side of ship lowering equipment into the water
Rapid Response OBS - Mendocino

Eric Moore (USGS) deploying one of the rapid response ocean bottom seismographs. Photo credit: Nathan Miller, USGS Woods Hole Coastal and Marine Science Center. 

Eric Moore (USGS) deploying one of the rapid response ocean bottom seismographs. Photo credit: Nathan Miller, USGS Woods Hole Coastal and Marine Science Center. 

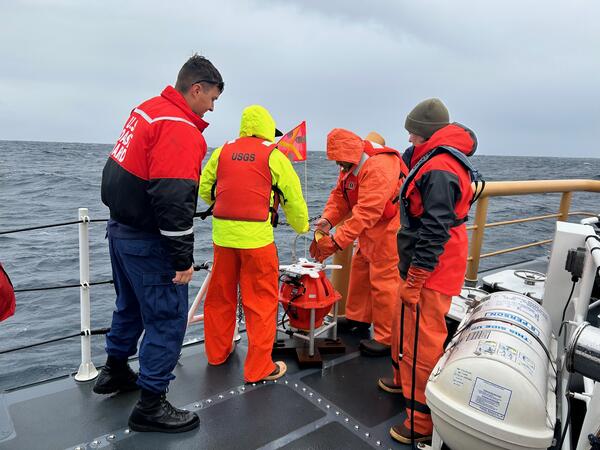
Four people on ship in ocean, huddled around a piece of equipment near railing
Rapid Response OBS - Mendocino

Wayne Baldwin (USGS), Eric Moore (USGS), and Hannah Brewer (Woods Hole Oceanographic Institution) about to deploy one of the rapid response ocean bottom seismograph fleet. Photo credit: Nathan Miller, USGS Woods Hole Coastal and Marine Science Center. 

Wayne Baldwin (USGS), Eric Moore (USGS), and Hannah Brewer (Woods Hole Oceanographic Institution) about to deploy one of the rapid response ocean bottom seismograph fleet. Photo credit: Nathan Miller, USGS Woods Hole Coastal and Marine Science Center. 

People on ship on ocean working on equipment
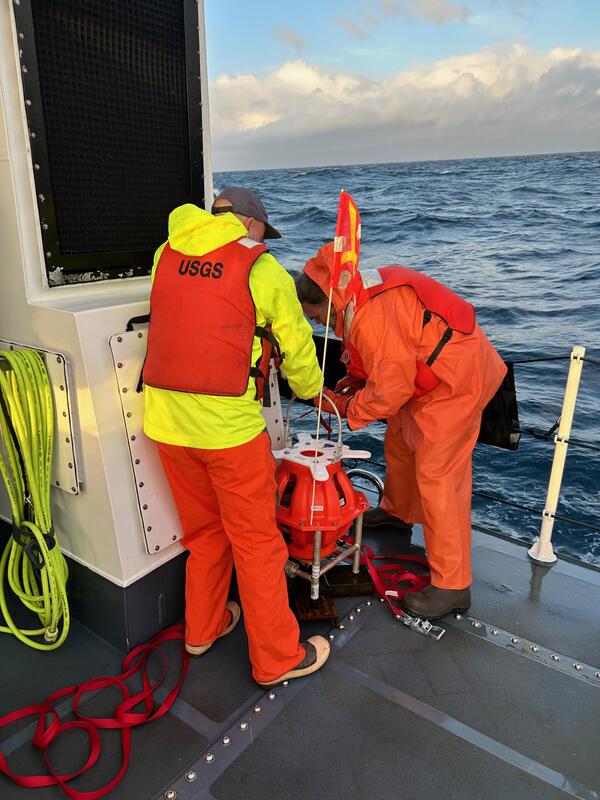
Rapid Response OBS - Mendocino

Wayne Baldwin (USGS) and Eric Moore (USGS) preparing the rapid response ocean bottom seismograph fleet for deployment. Photo credit: Nathan Miller, USGS Woods Hole Coastal and Marine Science Center. 

Wayne Baldwin (USGS) and Eric Moore (USGS) preparing the rapid response ocean bottom seismograph fleet for deployment. Photo credit: Nathan Miller, USGS Woods Hole Coastal and Marine Science Center. 

Three people on ship in the ocean, working on equipment
Rapid Response OBS - Mendocino

Wayne Baldwin (USGS) and Eric Moore (USGS) preparing the rapid response ocean bottom seismograph fleet for deployment. Photo credit: Nathan Miller, USGS Woods Hole Coastal and Marine Science Center. 

Wayne Baldwin (USGS) and Eric Moore (USGS) preparing the rapid response ocean bottom seismograph fleet for deployment. Photo credit: Nathan Miller, USGS Woods Hole Coastal and Marine Science Center. 

Two people on ship on the ocean hunched over equipment
Rapid Response OBS - Mendocino

Wayne Baldwin (USGS) and Eric Moore (USGS) preparing the rapid response ocean bottom seismograph fleet for deployment. Photo credit: Nathan Miller, USGS Woods Hole Coastal and Marine Science Center. 

Wayne Baldwin (USGS) and Eric Moore (USGS) preparing the rapid response ocean bottom seismograph fleet for deployment. Photo credit: Nathan Miller, USGS Woods Hole Coastal and Marine Science Center. 

Map showing hurricane movement, text overlaid reading Hurricane coastal impacts
NOPP Hurricane Coastal Impacts Geonarrative

As powerful hurricanes approach the coast, they generate elevated water levels and dangerous wave conditions that can cause extensive flooding, significant landscape changes, and destruction of property.

As powerful hurricanes approach the coast, they generate elevated water levels and dangerous wave conditions that can cause extensive flooding, significant landscape changes, and destruction of property.

Map showing hurricane movement, text overlaid reading Hurricane coastal impacts
NOPP Hurricane Coastal Impacts Geonarrative

As powerful hurricanes approach the coast, they generate elevated water levels and dangerous wave conditions that can cause extensive flooding, significant landscape changes, and destruction of property.

As powerful hurricanes approach the coast, they generate elevated water levels and dangerous wave conditions that can cause extensive flooding, significant landscape changes, and destruction of property.

An outline map of the United States and territories, included, showing the Coastcam location sites that broadcast images.
Coastcams Map with Coverage

An illustrated map of the United States and territories, displaying the site coverage of the Coastcam cameras that survey the coasts and provide imagery, with purple diamonds at these locations along the West and East Coast, Alaska and Puerto Rico.

An illustrated map of the United States and territories, displaying the site coverage of the Coastcam cameras that survey the coasts and provide imagery, with purple diamonds at these locations along the West and East Coast, Alaska and Puerto Rico.

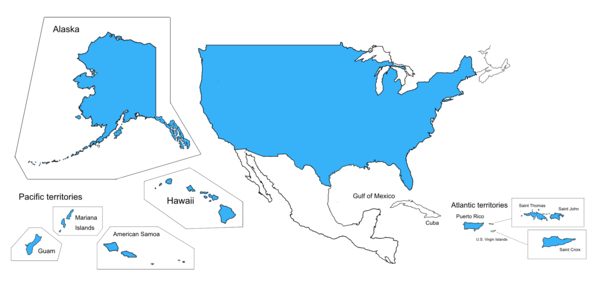
An illustrated map displaying the national coverage provided by the Flood Event Viewer product in blue
Flood Event Viewer Map Coverage

An illustrated map displaying the Flood Event Viewer national coverage, in blue, across the United States (East and West Coast), Alaska, Hawaii, and Pacific (Guam, American Samoa, Mariana Islands) and Atlantic territories (Puerto Rico, U.S. Virgin Islands)

An illustrated map displaying the Flood Event Viewer national coverage, in blue, across the United States (East and West Coast), Alaska, Hawaii, and Pacific (Guam, American Samoa, Mariana Islands) and Atlantic territories (Puerto Rico, U.S. Virgin Islands)

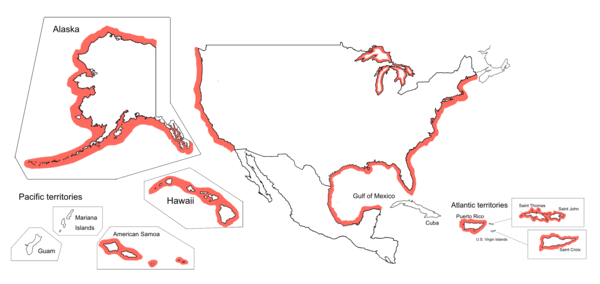
Illustrated map displaying the coverage provided by the Coastal Change Hazard Portal
Coastal Change Hazard Portal Map Coverage

Illustrated map displaying the coverage provided by the Coastal Change Hazard Portal for the U.S. East and West Coast, Great Lakes, Gulf of America, Hawaii, Alaska and Atlantic Territories (Puerto Rico and U.S. Virgin Islands) in red along the coasts to show the prediction output from CCHP.

Illustrated map displaying the coverage provided by the Coastal Change Hazard Portal for the U.S. East and West Coast, Great Lakes, Gulf of America, Hawaii, Alaska and Atlantic Territories (Puerto Rico and U.S. Virgin Islands) in red along the coasts to show the prediction output from CCHP.

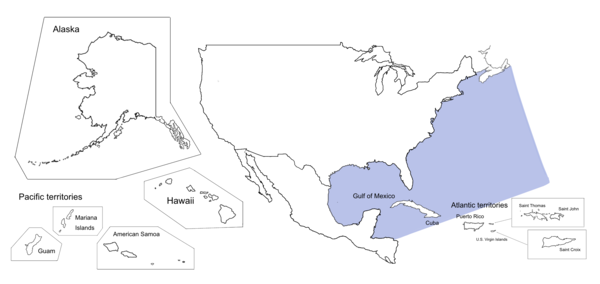
Illustrated map displaying the coverage provided by the Total Water Level and Coastal Change Forecast Viewer for the U.S. East Coast and Gulf of Mexico
Total Water Level and Coastal Change Forecast Viewer Coverage Map

Illustrated map displaying the coverage provided by the Total Water Level and Coastal Change Forecast Viewer for the U.S. East Coast and Gulf of America, in blue.

An illustrated map displaying the COAWST Modeling System product coverage along the U.S. East Coast and the Gulf of America.
COAWST Map Coverage
COAWST Map Coverage
COAWST Map Coverage

An illustrated map displaying the COAWST  Modeling System product coverage for U.S. East Coast and the Gulf of America.

An illustrated map displaying the COAWST  Modeling System product coverage for U.S. East Coast and the Gulf of America.

An illustrated map displaying the HERA product coverage for the U.S. West Coast and Pacific territories
HERA Coverage Map
HERA Coverage Map
HERA Coverage Map

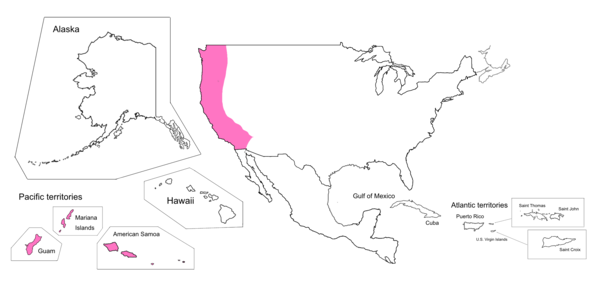
An illustrated map displaying the HERA product coverage, in pink, for the U.S. West Coast and Pacific territories for Emergency Management. Coverage includes Guam, Mariana Islands, American Samoa, 

An illustrated map displaying the HERA product coverage, in pink, for the U.S. West Coast and Pacific territories for Emergency Management. Coverage includes Guam, Mariana Islands, American Samoa, 

Four people smiling for photo outside on a sunny day holding up pair on decomposed clothing
TSU Visit
TSU Visit
TSU Visit

On October 16 and 17, Ben Gutierrez visited Tennessee State University (TSU) to give guest lecture in Environmental Science and Water Resource classes taught by Tom Byl of the USGS Lower Mississippi Gulf Water Science Center.

On October 16 and 17, Ben Gutierrez visited Tennessee State University (TSU) to give guest lecture in Environmental Science and Water Resource classes taught by Tom Byl of the USGS Lower Mississippi Gulf Water Science Center.

Two people smiling for photo outside holding decomposed clothing
TSU Visit
TSU Visit
TSU Visit

On October 16 and 17, Ben Gutierrez visited Tennessee State University (TSU) to give guest lecture in Environmental Science and Water Resource classes taught by Tom Byl of the USGS Lower Mississippi Gulf Water Science Center.

On October 16 and 17, Ben Gutierrez visited Tennessee State University (TSU) to give guest lecture in Environmental Science and Water Resource classes taught by Tom Byl of the USGS Lower Mississippi Gulf Water Science Center.

Was this page helpful?