
Scientists use mealworms to train two lesser scaup ducklings to peck at a target after tones are played at certain frequencies. This species was studied as part of research by the USGS and partners to identify the frequencies at which sea ducks can hear underwater.
Images
Images
Filter Total Items: 9449

Scientists train lesser scaup ducklings
Scientists use mealworms to train two lesser scaup ducklings to peck at a target after tones are played at certain frequencies. This species was studied as part of research by the USGS and partners to identify the frequencies at which sea ducks can hear underwater.

Common eider ducklings
Two common eider ducklings. This species was studied as part of research by the USGS and partners to identify the frequencies at which sea ducks can hear underwater.
Two common eider ducklings. This species was studied as part of research by the USGS and partners to identify the frequencies at which sea ducks can hear underwater.

Common eider
A common eider duck. This species was studied as part of research by the USGS and partners to identify the frequencies at which sea ducks can hear underwater. The research can help inform decisions on the use of sound devices to deter ducks from fishing gillnets and other threats.
A common eider duck. This species was studied as part of research by the USGS and partners to identify the frequencies at which sea ducks can hear underwater. The research can help inform decisions on the use of sound devices to deter ducks from fishing gillnets and other threats.

Surf scoter duck
Scientists record whether a surf scoter duck pecks at a target after tones are played at certain frequencies. This is part of a study by the USGS and partners to identify the frequencies at which sea ducks can hear underwater.
Scientists record whether a surf scoter duck pecks at a target after tones are played at certain frequencies. This is part of a study by the USGS and partners to identify the frequencies at which sea ducks can hear underwater.

Long-tailed duckling
A long-tailed duckling. This species was studied as part of research by the USGS and partners to identify the frequencies at which sea ducks can hear underwater.
A long-tailed duckling. This species was studied as part of research by the USGS and partners to identify the frequencies at which sea ducks can hear underwater.
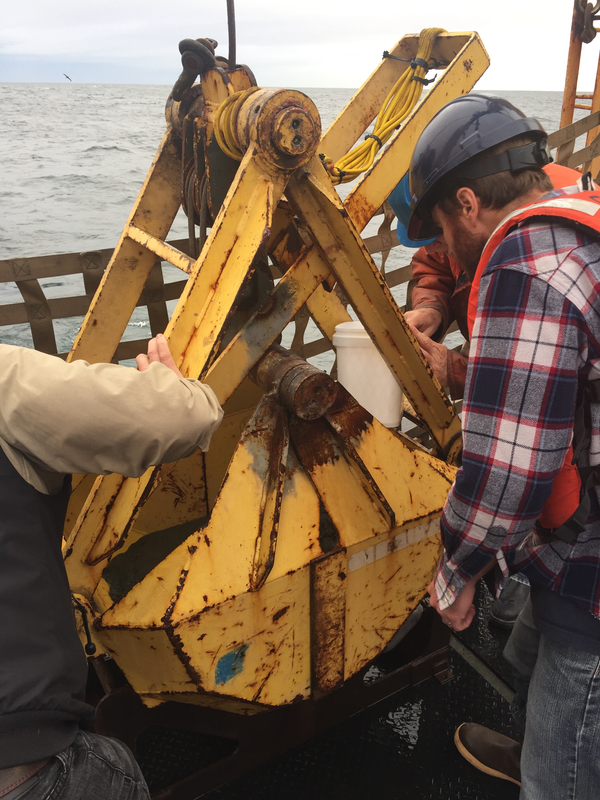
Examining bucket of seafloor sediment collected off southeast Alaska
Examining bucket of seafloor sediment collected off southeast AlaskaUSGS research geophysicist Danny Brothers (right) and colleagues examine the surface of a sediment grab sample just pulled onto the deck of the Canadian Coast Guard Ship John P. Tully. The sample was collected from the top of a mud volcano north of the border between southeast Alaska and British Columbia.

Soil Burn Severity Map for Eagle Creek Fire, Oregon 2017
Soil Burn Severity Map for Eagle Creek Fire, Oregon 2017Soil burn severity for the Eagle Creek Fire, Oregon (2017). Soil burn severity is used for postfire assessments to determine flash flooding and postfire debris flow potential for a recently burned area.

R/V Arcticus at Sturgeon Bay
Fog surrounds the USGS Research Vessel Arcticus as it comes into port at Sturgeon Bay, Wisconsin.
Fog surrounds the USGS Research Vessel Arcticus as it comes into port at Sturgeon Bay, Wisconsin.

Collecting a piston core of seafloor sediment off British Columbia
Collecting a piston core of seafloor sediment off British ColumbiaScientists prepare to lower a piston corer off Haida Gwaii, British Columbia, to sample seafloor sediment near the Queen Charlotte-Fairweather fault. Expedition scientists are studying layers of sediment in the cores they collected to identify and determine ages of past earthquakes along the fault.

USGS Storm-Tide Sensor installed for Hurricane Jose
USGS Storm-Tide Sensor installed for Hurricane JoseA USGS specialist installs a storm-tide sensor in Massachusetts before Hurricane Jose's arrival.
USGS Storm-Tide Sensor installed for Hurricane Jose
USGS Storm-Tide Sensor installed for Hurricane JoseA USGS specialist installs a storm-tide sensor in Massachusetts before Hurricane Jose's arrival.

Sampling core fluid from sediment cores collected off southeast Alaska
Sampling core fluid from sediment cores collected off southeast AlaskaMary McGann (left, USGS) and Rachel Lauer (University of Calgary) sample pore fluids from sediment cores collected aboard the Canadian Coast Guard Ship John P. Tully along the Queen Charlotte-Fairweather fault offshore of southeast Alaska.

Study area for first Deep SEARCH research cruise
Map of target areas to be surveyed during the first phase of the
Deepwater Atlantic Habitats II study, DEEP SEARCH, including seep targets. USGS image.
Map of target areas to be surveyed during the first phase of the
Deepwater Atlantic Habitats II study, DEEP SEARCH, including seep targets. USGS image.

Areas to be surveyed on first Deep SEARCH research cruise
Areas to be surveyed on first Deep SEARCH research cruiseMap of target areas to be surveyed during the first phase of the Deepwater Atlantic Habitats II study,
DEEP SEARCH, including seep targets. USGS image.
Areas to be surveyed on first Deep SEARCH research cruise
Areas to be surveyed on first Deep SEARCH research cruiseMap of target areas to be surveyed during the first phase of the Deepwater Atlantic Habitats II study,
DEEP SEARCH, including seep targets. USGS image.

Taking a High-Water Mark after Hurricane Harvey
USGS scientist Steve Hannes marks high water marks along the Colorado River after flooding from Harvey in Matagorda County, Texas.
USGS scientist Steve Hannes marks high water marks along the Colorado River after flooding from Harvey in Matagorda County, Texas.

Flooding on Atlantic Avenue in Garden City, SC
That photo is of Atlantic Avenue in Garden City, South Carolina on September 11.
That photo is of Atlantic Avenue in Garden City, South Carolina on September 11.

Taking a High-Water Mark after Hurricane Harvey
USGS scientist Steve Hannes marks high water marks along the Colorado River after flooding from Hurricane Harvey in Wharton County, Texas.
USGS scientist Steve Hannes marks high water marks along the Colorado River after flooding from Hurricane Harvey in Wharton County, Texas.

Recording high water marks following Harvey
USGS scientist David Rodriguez records high water marks from storm surge following Harvey near Corpus Christi, Texas.
USGS scientist David Rodriguez records high water marks from storm surge following Harvey near Corpus Christi, Texas.

Recording high water marks after Harvey
USGS scientist David Rodriguez records high water marks from storm surge near Corpus Christi, Texas.
USGS scientist David Rodriguez records high water marks from storm surge near Corpus Christi, Texas.

High Water Mark Surveying
USGS scientist Alec McDonald surveying high water marks from storm surge from Hurricane Harvey at Packery Channel near Corpus Christi, Texas.
USGS scientist Alec McDonald surveying high water marks from storm surge from Hurricane Harvey at Packery Channel near Corpus Christi, Texas.