
Photo of Pecora 2024 Team Award winners with representatives from USGS and NASA.
Images
With 50 years of satellite observations to draw from, the Landsat Archive has no shortage of beautiful and informative imagery to share. Peruse some of the best below.
Filter Total Items: 66

Pecora Team Award, 2024.jpeg
Photo of Pecora 2024 Team Award winners with representatives from USGS and NASA.

USGS and German Aerospace Center sign statement of intent for upcoming Landsat Next mission.
USGS and German Aerospace Center sign statement of intent for upcoming Landsat Next mission.The U.S. Geological Survey and German Aerospace Center (Deutsches Zentrum für Luft-und Raumfahrt or DLR sign statement for plans to continue partnership with the upcoming Landsat Next satellite mission.

Inaugural U.S.-Germany Space Dialogue Space Dialogue
Inaugural U.S.-Germany Space Dialogue Space DialogueImage from the inaugural U.S.-Germany Space Dialogue Space Dialogue in Berlin on June 4, 2024.
Inaugural U.S.-Germany Space Dialogue Space Dialogue
Inaugural U.S.-Germany Space Dialogue Space DialogueImage from the inaugural U.S.-Germany Space Dialogue Space Dialogue in Berlin on June 4, 2024.

USGS and German Aerospace Center sign statement of intent for Landsat Next mission.
USGS and German Aerospace Center sign statement of intent for Landsat Next mission.USGS and German Aerospace Center sign statement of intent for upcoming Landsat Next mission.
(Left to Right): Head of the DLR Space Division Dr. Anke Pagels-Kerp and USGS Deputy Director-Operations Cindy Lodge.

USGS Deputy Director-Operations Cindy Lodge with DLR’s German Remote Sensing Data Center (DFD) Director professor Stefan Dech.
USGS Deputy Director-Operations Cindy Lodge with DLR’s German Remote Sensing Data Center (DFD) Director professor Stefan Dech.USGS Deputy Director-Operations Cindy Lodge shown here with DLR’s German Remote Sensing Data Center (DFD) Director professor Stefan Dech at DLR’s Earth Observation Center in Oberpfaffenhofen finalizing the signatures on the statement of intent for the upcoming Landsat Next mission.

Landsat Scene Downloads from USGS Inventory since 2008
Landsat Scene Downloads from USGS Inventory since 2008This graphic displays the millions of Landsat Level-1 downloads, from 2008 to December 2022.
View more statistics on the Landsat Project Statistics page.
Landsat Scene Downloads from USGS Inventory since 2008
Landsat Scene Downloads from USGS Inventory since 2008This graphic displays the millions of Landsat Level-1 downloads, from 2008 to December 2022.
View more statistics on the Landsat Project Statistics page.

Charlotte and Monroe, North Carolina
In 2022, President Joe Biden pardoned two turkeys, Chocolate and Chip. The two holiday birds hail from a ranch in Monroe, North Carolina.
In 2022, President Joe Biden pardoned two turkeys, Chocolate and Chip. The two holiday birds hail from a ranch in Monroe, North Carolina.

Landsat 9 Image of Kangerdlugssuaq Glacier, Greenland
Landsat 9 Image of Kangerdlugssuaq Glacier, GreenlandNamed after a Greenlandic word meaning “large fjord,” Kangerdlugssuaq Glacier is one of the largest tidewater outlet glaciers in Greenland. It flows from the fjord of the same name, the second largest found on the east side of the island. This false color Landsat 9 image was acquired July 29, 2022, using Bands 5|4|3.

Landsat 8 Image of the Great Salt Lake in July, 2022
Landsat 8 Image of the Great Salt Lake in July, 2022Natural Color Landsat 8 image of the Great Salt Lake, acquired on July 3, 2022. On July 3, the level of Great Salt Lake dropped below the October 2021 historic low elevation.
Landsat 8 Image of the Great Salt Lake in July, 2022
Landsat 8 Image of the Great Salt Lake in July, 2022Natural Color Landsat 8 image of the Great Salt Lake, acquired on July 3, 2022. On July 3, the level of Great Salt Lake dropped below the October 2021 historic low elevation.

Landsat Collections Screenshot
This screenshot shows what the Landsat Collections interactive looks like. This storymap collection combines all of the individual satellite storymaps into one location.
This screenshot shows what the Landsat Collections interactive looks like. This storymap collection combines all of the individual satellite storymaps into one location.

Landsat 8 Thermal Infrared Sensor Image near Ogallala, Nebraska
Landsat 8 Thermal Infrared Sensor Image near Ogallala, NebraskaLandsat 8 thermal infrared (Band 10) image near Ogallala, Nebraska, showing fields with center pivot irrigation. The Thermal Infrared Sensor (TIRS) on Landsat 8-9 measures energy radiated by the earth of the surface with two spectral bands that can be used to derive surface temperature.
The image was acquired on August 17, 2021 from Path 31 Row 32.

Landsat 9 Image of Amsterdam
Extending from the North Sea to Amsterdam, the North Sea Canal cuts across the landscape in this natural color Landsat 9 image from April 24, 2022. Amsterdam, located on the east end of the canal, is known for its intricate canal system dividing the city into 90 islands. The body of water on the right is part of Markermer Lake.
Extending from the North Sea to Amsterdam, the North Sea Canal cuts across the landscape in this natural color Landsat 9 image from April 24, 2022. Amsterdam, located on the east end of the canal, is known for its intricate canal system dividing the city into 90 islands. The body of water on the right is part of Markermer Lake.

Landsat 8 image of Karymsky volcano, April 20, 2022
Landsat 8 image of Karymsky volcano, April 20, 2022Karymsky volcano, one of the most active volcanoes of Kamchatka's eastern volcanic zone, erupted on April 20, 2022. This pan-sharpened Landsat 8 image captured the event. Overlaying the infrared data over the natural color image highlights the heat signature of the active flows.
Landsat ID: LC08_L1TP_098022_20220420_20220420_02_RT

Landsat 9 image of the SANSA Ground Station
Landsat 9 image of the South African National Space Agency's (SANSA) Hartebeesthoek ground station in Pretoria, South Africa. Part of the The USGS Landsat International Cooperator Network, the ground station celebrated its 50th anniversary in 2022.
Landsat 9 image of the South African National Space Agency's (SANSA) Hartebeesthoek ground station in Pretoria, South Africa. Part of the The USGS Landsat International Cooperator Network, the ground station celebrated its 50th anniversary in 2022.

Landsat 9 Image of Ramas Bridge
This Landsat 9 image displays Rama's Bridge (also known as Rama Setu, or Adam's Bridge), a 48 kilometer chain of limestone shoals & sand bars between Pamban Island, off the south-eastern coast of India, and Mannar Island, off the north-western coast of Sri Lanka.
This Landsat 9 image displays Rama's Bridge (also known as Rama Setu, or Adam's Bridge), a 48 kilometer chain of limestone shoals & sand bars between Pamban Island, off the south-eastern coast of India, and Mannar Island, off the north-western coast of Sri Lanka.

Landsat 7 First Light Image of Eastern South Dakota
Landsat 7 First Light Image of Eastern South DakotaThis color infrared image of Southeast South Dakota and Northeast Nebraska was advertised as the first image acquired by Landsat 7's Enhanced Thematic Mapper Plus (ETM+) sensor on April 18, 1999.
Landsat 7 First Light Image of Eastern South Dakota
Landsat 7 First Light Image of Eastern South DakotaThis color infrared image of Southeast South Dakota and Northeast Nebraska was advertised as the first image acquired by Landsat 7's Enhanced Thematic Mapper Plus (ETM+) sensor on April 18, 1999.

Fire near Uljin-eup, South Korea (False Color)
Landsat 9 captured an image of the ongoing fire in Uljin county on South Korea’s west coast. The false color image looks beneath the smoke and shows the burn scar as reddish-brown and the heat signature from the fire as bright red.
Landsat 9 captured an image of the ongoing fire in Uljin county on South Korea’s west coast. The false color image looks beneath the smoke and shows the burn scar as reddish-brown and the heat signature from the fire as bright red.
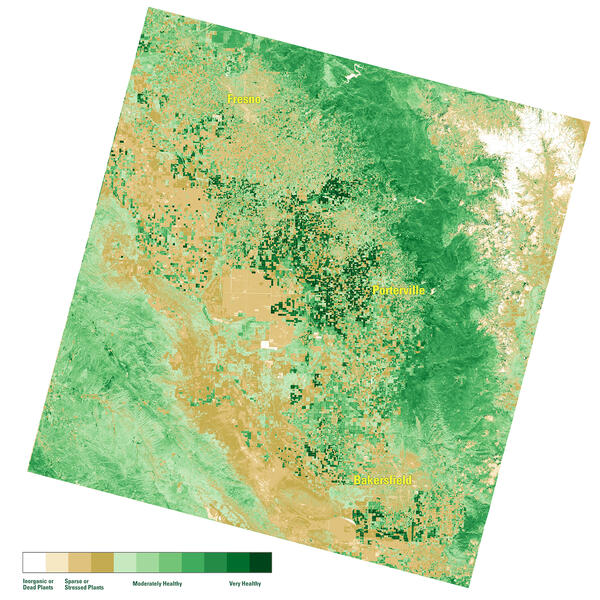
NDVI map of the San Joaquin Valley Region, March 10, 2022
NDVI map of the San Joaquin Valley Region, March 10, 2022A Landsat Surface Reflectance (SR) Normalized Difference Index (NDVI) map of the San Joaquin Valley region of California on March 10, 2022.
NDVI map of the San Joaquin Valley Region, March 10, 2022
NDVI map of the San Joaquin Valley Region, March 10, 2022A Landsat Surface Reflectance (SR) Normalized Difference Index (NDVI) map of the San Joaquin Valley region of California on March 10, 2022.

Landsat 9 image of Bangladesh Coast
Landsat 9 natural color image (Bands 4, 3, 2) of the Bangladesh coastline on the Bay of Bengal acquired on February 8, 2022. The Sundarbans mangrove forest, a protected UNESCO area, appears as dark green on the left side of the image. The right side of the image shows agricultural lands and urban areas as light tan and gray.
Landsat 9 natural color image (Bands 4, 3, 2) of the Bangladesh coastline on the Bay of Bengal acquired on February 8, 2022. The Sundarbans mangrove forest, a protected UNESCO area, appears as dark green on the left side of the image. The right side of the image shows agricultural lands and urban areas as light tan and gray.

Landsat 9 image of San Francisco Bay, California
This natural color Landsat 9 image from December 10, 2021 shows the cities of San Francisco, San Jose, and Oakland surrounding the San Francisco Bay. The bay is the largest estuary on the west coast and includes a patchwork of mud flats, salt marshes, and salt ponds.
This natural color Landsat 9 image from December 10, 2021 shows the cities of San Francisco, San Jose, and Oakland surrounding the San Francisco Bay. The bay is the largest estuary on the west coast and includes a patchwork of mud flats, salt marshes, and salt ponds.

Landsat 9 Image of Western Guinea-Bissau
The Geba River on the west coast of Guinea-Bissau is seen in this natural color Landsat 9 image from February 8, 2022. Silt carried by the river into the Atlantic Ocean creates intricate patterns as it moves around the Bissagos (or Bijagós) Islands. The country’s capital, Bissau, can be seen on the north side of the estuary and appears as light brown.
The Geba River on the west coast of Guinea-Bissau is seen in this natural color Landsat 9 image from February 8, 2022. Silt carried by the river into the Atlantic Ocean creates intricate patterns as it moves around the Bissagos (or Bijagós) Islands. The country’s capital, Bissau, can be seen on the north side of the estuary and appears as light brown.