
Isolated silicon specimen from the USGS mineral collection. High-definition image showing metallic luster and crystalline texture.
Images
Energy and Minerals Mission Area images.
Filter Total Items: 523
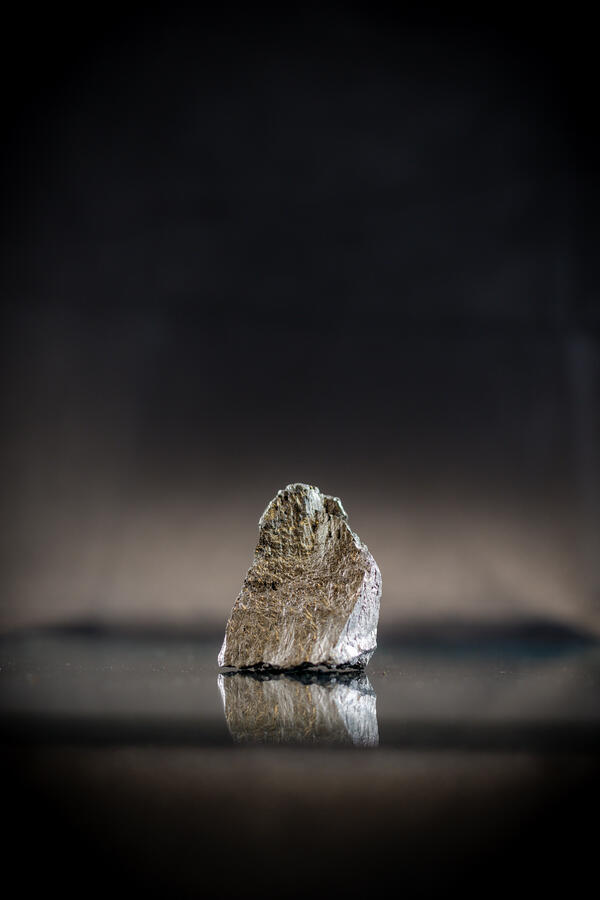
Silicon Sample
Isolated silicon specimen from the USGS mineral collection. High-definition image showing metallic luster and crystalline texture.
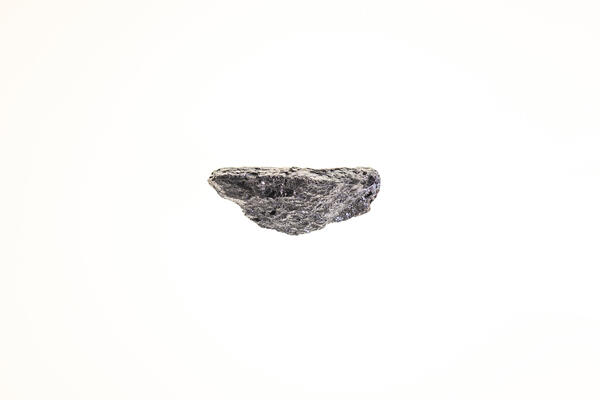
Silicon Metal Sample 2
Isolated silicon metal specimen from the USGS mineral collection. High-definition image showing metallic luster and smooth texture.
Isolated silicon metal specimen from the USGS mineral collection. High-definition image showing metallic luster and smooth texture.
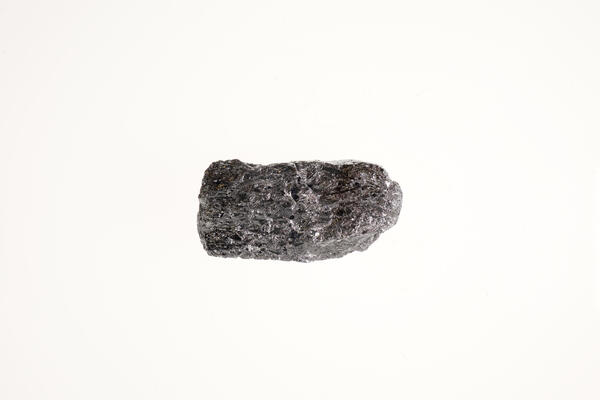
Silicon Metal Sample 3
High-definition image of silicon metal specimen with fine-grained texture and silvery color.
High-definition image of silicon metal specimen with fine-grained texture and silvery color.
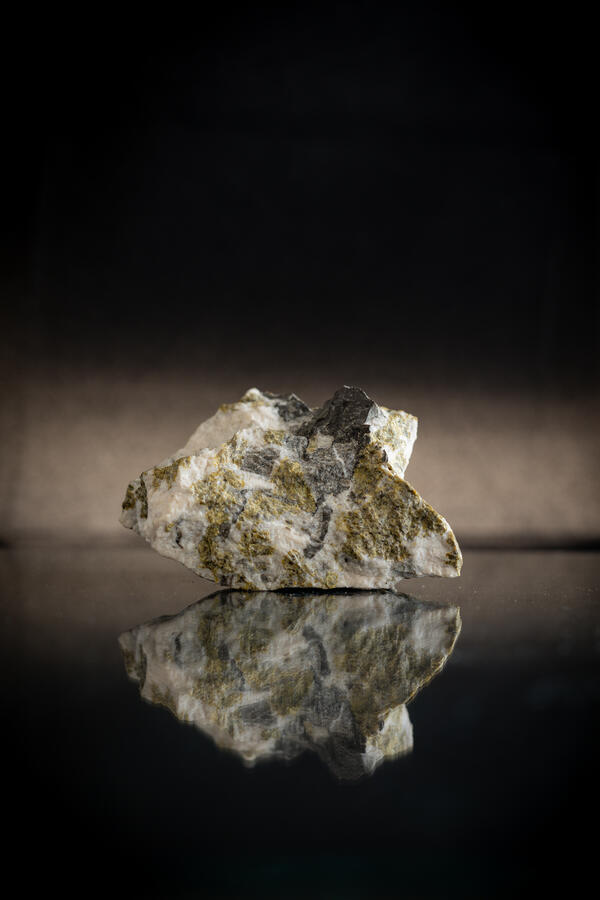
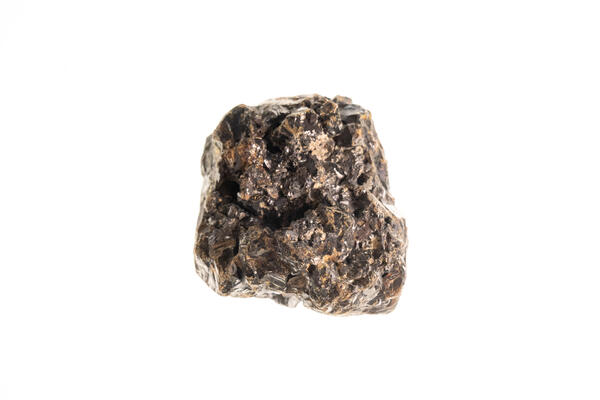
Sphalerite Specimen
Isolated sphalerite specimen from the USGS mineral collection. High-definition image showing resinous luster and granular texture.
Isolated sphalerite specimen from the USGS mineral collection. High-definition image showing resinous luster and granular texture.
Sphalerite Specimen 7
High-definition image of sphalerite specimen with fine-grained texture and metallic sheen.
High-definition image of sphalerite specimen with fine-grained texture and metallic sheen.
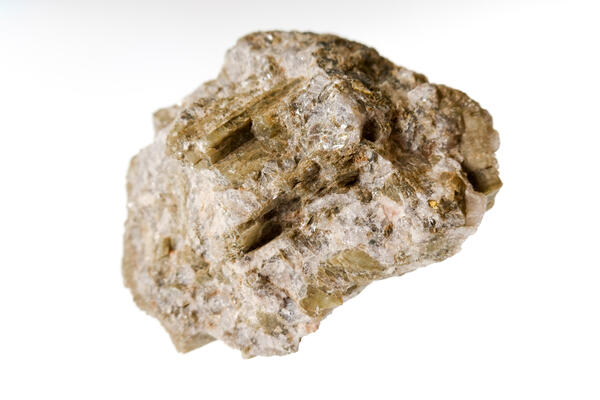
Spodumene Specimen
Isolated spodumene specimen from the USGS mineral collection. High-definition image showing prismatic crystal structure and pale green color.
Isolated spodumene specimen from the USGS mineral collection. High-definition image showing prismatic crystal structure and pale green color.
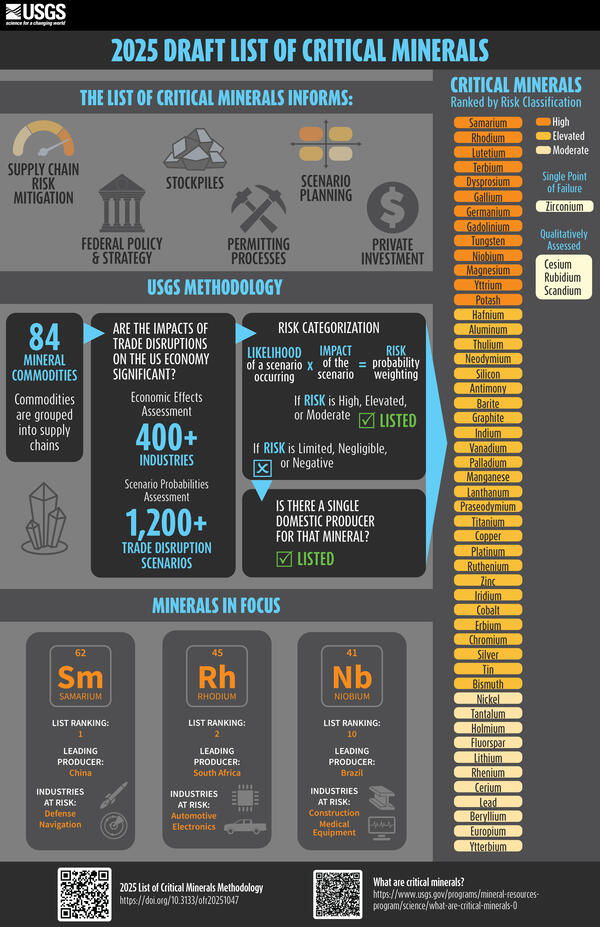
2025 Draft List of Critical Minerals
The List of Critical Minerals Informs:
-
Supply chain risk mitigation
-
Federal policy and strategy
-
Stockpiles
-
Permitting Processes
The List of Critical Minerals Informs:
-
Supply chain risk mitigation
-
Federal policy and strategy
-
Stockpiles
-
Permitting Processes
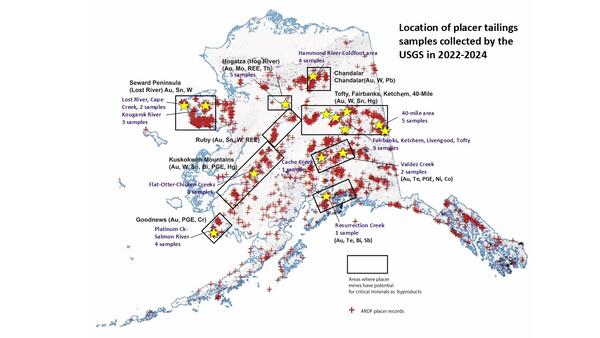
Alaska locations of USGS placer tailings sampling sites
Alaska locations of USGS placer tailings sampling sitesMap showing locations of placer mines in the Alaska Resource Data File (ARDF, red crosses), primary mineral districts that contain targeted critical minerals (black boxes) and locations that were sampled by the USGS in 2022 through 2024 (yellow stars).
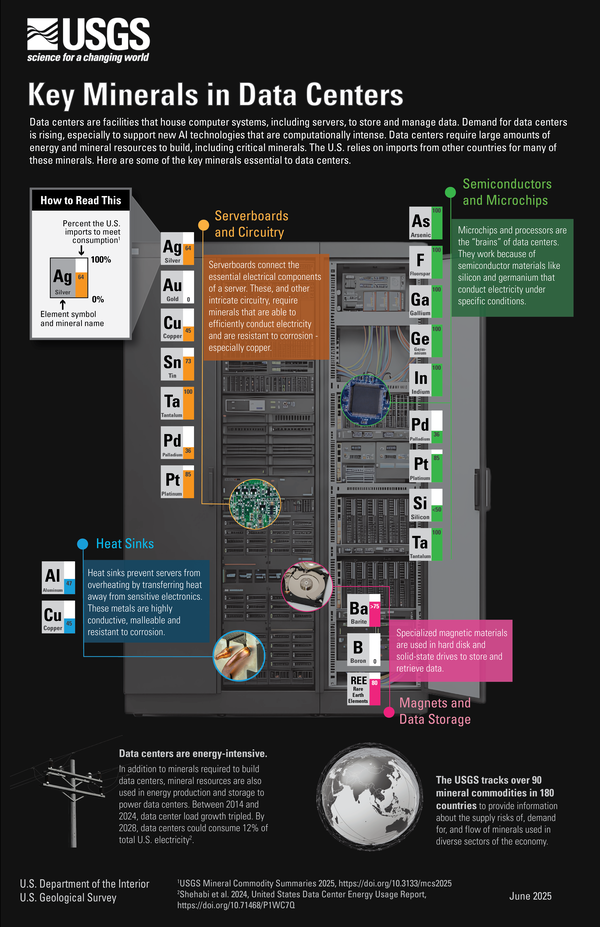
Key Minerals in Data Centers Infographic
Key Minerals in Data Centers
Hydrothermal Energy Resources (Illustrated GIF)
Conventional hydrothermal resources occur below the ground where three ingredients combine: heat, water and permeable rock. When heated water or steam is trapped in a porous rock below a layer of less permeable rock, a hydrothermal reservoir is formed.
Conventional hydrothermal resources occur below the ground where three ingredients combine: heat, water and permeable rock. When heated water or steam is trapped in a porous rock below a layer of less permeable rock, a hydrothermal reservoir is formed.
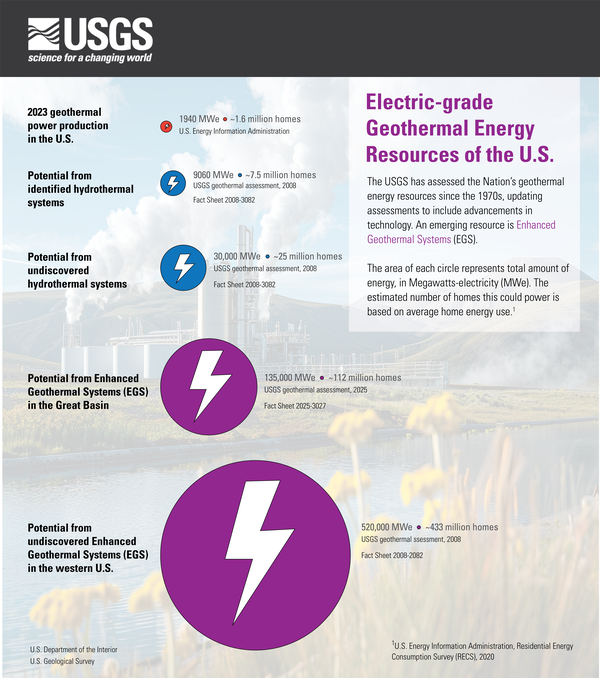
Electric-grade geothermal energy resources of the U.S.
Electric-grade geothermal energy resources of the U.S.Infographic of Electric-grade geothermal energy resources of the U.S.
The USGS has assessed the Nation’s geothermal energy resources since the 1970s, updating assessments to include advancements in technology. An emerging resource is Enhanced Geothermal Systems (EGS).
Enhanced Geothermal Systems (Illustrated GIF)
Enhanced Geothermal Systems are an emerging resource that the USGS studies. To generate electricity from these systems, fractures are engineered into deep, low-porosity hot rocks to allow water to circulate. Then, the heated water is pumped back to the surface, where the thermal energy is used to move a turbine and generate electricity.
Enhanced Geothermal Systems are an emerging resource that the USGS studies. To generate electricity from these systems, fractures are engineered into deep, low-porosity hot rocks to allow water to circulate. Then, the heated water is pumped back to the surface, where the thermal energy is used to move a turbine and generate electricity.
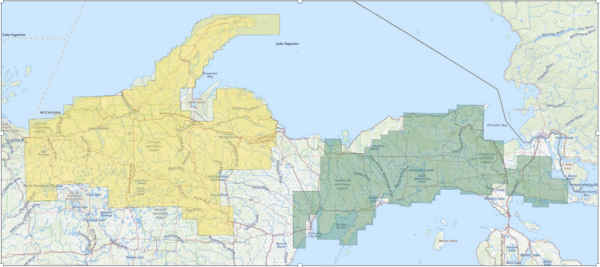
UPMI-WS LLFA.png
Map of the Upper Peninsula of Michigan and nearby areas of Northern Wisconsin, with areas of overflights shaded in yellow (Wisconsin) and green (Michigan).
Map of the Upper Peninsula of Michigan and nearby areas of Northern Wisconsin, with areas of overflights shaded in yellow (Wisconsin) and green (Michigan).

Minerals with Net Import Reliance on China
Mineral Commodities with Net Import Reliance on China
USGS collects the Nation’s data on the global production, supply, demand and trade of minerals to inform strategic policy, trade and land-use decisions.
Mineral Commodities with Net Import Reliance on China
USGS collects the Nation’s data on the global production, supply, demand and trade of minerals to inform strategic policy, trade and land-use decisions.

Mineral Systems Map: Areas with Potential to Host Subsurface Critical Minerals
Mineral Systems Map: Areas with Potential to Host Subsurface Critical MineralsThis map shows the mineral systems map from the Earth Mapping Resources Initiative (Earth MRI). Through Earth MRI, USGS brings together federal and state experts to:

Solid Gallium Metal
Gallium is used in gallium arsenide and gallium nitride compound semiconductors. There is additional production capacity for gallium outside China with the potential to produce gallium in Germany, Kazakhstan and South Korea in response to China’s gallium export ban to the U.S.
Gallium is used in gallium arsenide and gallium nitride compound semiconductors. There is additional production capacity for gallium outside China with the potential to produce gallium in Germany, Kazakhstan and South Korea in response to China’s gallium export ban to the U.S.

Multidisciplinary approach to prioritize critical elements for environmental research.
Multidisciplinary approach to prioritize critical elements for environmental research.This infographic introduces an approach that could subsequently be used to prioritize environmental research for the full range of critical elements.
By
Ecosystems Mission Area, Energy and Mineral Resources Mission Area, Contaminant Biology, Environmental Health Program, Toxic Substances Hydrology, Geology, Energy & Minerals Science Center, Geology, Geophysics, and Geochemistry Science Center, Geology, Minerals, Energy, and Geophysics Science Center

USGS science supports the low-carbon energy transition infographic
USGS science supports the low-carbon energy transition infographicOur science is supporting the low-carbon energy transition.
USGS science supports the low-carbon energy transition infographic
USGS science supports the low-carbon energy transition infographicOur science is supporting the low-carbon energy transition.
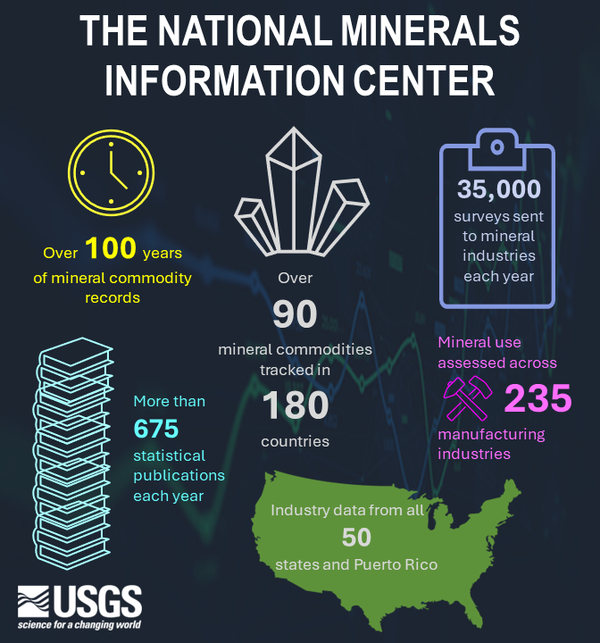
National Minerals Information Center By-the-Numbers
National Minerals Information Center By-the-NumbersThe National Minerals Information Center:
National Minerals Information Center By-the-Numbers
National Minerals Information Center By-the-NumbersThe National Minerals Information Center:

Schematic Diagram of Water Flow for Conventional Flotation Processing of Copper Ores (Bleiwas, 2012)
Schematic Diagram of Water Flow for Conventional Flotation Processing of Copper Ores (Bleiwas, 2012)Schematic diagram of water flow for conventional flotation processing of copper ores from Bleiwas, D.I., 2012, Estimated water requirements for the conventional flotation of copper ores: U.S. Geological Survey Open-File Report 2012–1089, 13 p., available at https://pubs.usgs.gov/publication/ofr20121089

Earth MRI First Five Years Accomplishments
Earth MRI: The First Five Years
The Earth Mapping Resources Initiative (Earth MRI) is modernizing the Nation’s mapping and geoscience data, benefitting regions, states and local communities.
By the Numbers:
40 States and Territories partnered with Earth MRI
Earth MRI: The First Five Years
The Earth Mapping Resources Initiative (Earth MRI) is modernizing the Nation’s mapping and geoscience data, benefitting regions, states and local communities.
By the Numbers:
40 States and Territories partnered with Earth MRI