
Word cloud visually representing the 200 most frequently used words in the titles and abstracts of our publications, illustrating key themes and research focus areas (as of September 2020).
Images
Explore water-related photography, imagery, and illustrations.
Filter Total Items: 2560
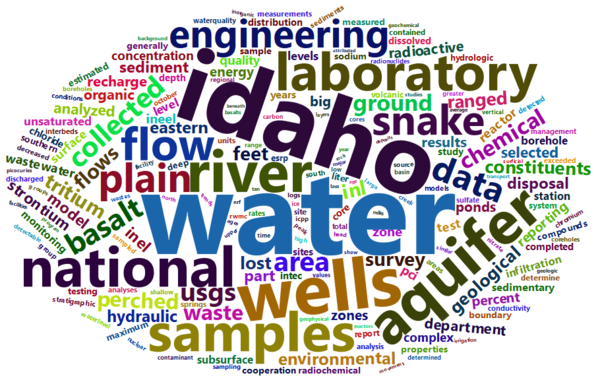
INLPO Wordcloud
Word cloud visually representing the 200 most frequently used words in the titles and abstracts of our publications, illustrating key themes and research focus areas (as of September 2020).

August 2020 Active Groundwater Level Network Animation
August 2020 Active Groundwater Level Network AnimationThe USGS Active Groundwater Level Network includes about 20,000 wells that have been measured by the USGS or USGS cooperators at least once within the past 13 months. The animation shows a daily snapshot of water-level statistics in the network for August 2020.

USGS Director Jim Reilly gives a speech
The USGS Forest and Rangeland Ecosystem Science Center (FRESC) held a groundbreaking ceremony on August 25, 2020 at the Idaho Water Science Center (IDWSC) in Boise, Idaho.
The USGS Forest and Rangeland Ecosystem Science Center (FRESC) held a groundbreaking ceremony on August 25, 2020 at the Idaho Water Science Center (IDWSC) in Boise, Idaho.

Wildwood NJ Surf
Photo of the surf and clouds in Wildwood, NJ November 2019.
Photo of the surf and clouds in Wildwood, NJ November 2019.

International Hydrological Studies Map
International Hydrological Studies Map

Visualization of an ensemble of solutions for PEST++
Visualization of an ensemble of solutions for PEST++The left axis is a visualization of an ensemble of solutions (crosses and dashed lines) iteratively moving down gradient on an objective function surface (color flood) in 2-D parameters space, with the associated prior (gray) and posterior (blue) parameter marginal distributions shown on the two right stacked axes.

Flooded Pennsylvania Streamgage after Hurricane Isaias
Flooded Pennsylvania Streamgage after Hurricane IsaiasThis USGS streamgage on Schantz Spring near Wescosville, Pennsylvania was partially submerged after floodwaters from Tropical Storm Isaias quickly rose and flooded the area.
Flooded Pennsylvania Streamgage after Hurricane Isaias
Flooded Pennsylvania Streamgage after Hurricane IsaiasThis USGS streamgage on Schantz Spring near Wescosville, Pennsylvania was partially submerged after floodwaters from Tropical Storm Isaias quickly rose and flooded the area.

Measuring streamflow on Rock Creek after Hurricane Isaias
Measuring streamflow on Rock Creek after Hurricane IsaiasFisseha Mengistu, USGS hydrologic technician, uses a device that lowers a water sampler into the creek below to collect samples used for water quality testing. Experts will be able to use this data to track how Tropical Storm Isaias impacted water quality in the area. This work was done on Rock Creek in Washington, D.C.

This USGS storm tide sensor installed for Hurricane Isaias.
This USGS storm tide sensor installed for Hurricane Isaias.This USGS storm tide sensor was installed August 1 in North Myrtle Beach, South Carolina to measure the coastal impacts of Hurricane Isaias. Photo by Joshua Lee, USGS.
This USGS storm tide sensor installed for Hurricane Isaias.
This USGS storm tide sensor installed for Hurricane Isaias.This USGS storm tide sensor was installed August 1 in North Myrtle Beach, South Carolina to measure the coastal impacts of Hurricane Isaias. Photo by Joshua Lee, USGS.

RDG installed in NC to monitor potential flooding caused by Isaias
RDG installed in NC to monitor potential flooding caused by IsaiasThis rapid deployment gauge was installed August 1 in Swansboro, North Carolina on the White Oak River to monitor water levels in order track potential flooding caused by Tropical Storm Isaias. Photo by Bryce McClenney, USGS.

USGS gage 02172002 Lake Moultrie Tailrace Canal, SC

USGS 021720508 COOPER RIVER ABOVE GOOSE CREEK,SC

USGS gage 02172020 Cooper River at Pimlico, SC 2

USGS gage 02172020 Cooper River at Pimlico, SC

USGS gage 04159130 St. Clair River at Port Huron, MI
USGS gage 04159130 St. Clair River at Port Huron, MIJosh Loewel, Hydrologic Technician for the Upper Midwest Water Science Center, Lansing Office, servicing the ADVM at St. Clair River at Port Huron, MI (USGS Station Number 04159130). Photograph was taken looking southeast, with the city of Sarnia, Ontario on the opposite bank of the river.

USGS employee collects water quality samples alongside boat
USGS employee collects water quality samples alongside boatA USGS employee collecting data for the Lake Tahoe Nearshore Nutrient Source Identification Project.

USGS employee collects data for Lake Tahoe Nutrient Project
USGS employee collects data for Lake Tahoe Nutrient ProjectA USGS employee collecting data for the Lake Tahoe Nearshore Nutrient Source Identification Project.

David O'Leary setting up the RTK GPS base station.
David O'Leary setting up the RTK GPS base station.David O'Leary is setting up the RTK GPS base station to establish a base elevation on a point above the Colorado River downstream of the rapids of Cataract Canyon.
David O'Leary setting up the RTK GPS base station.
David O'Leary setting up the RTK GPS base station.David O'Leary is setting up the RTK GPS base station to establish a base elevation on a point above the Colorado River downstream of the rapids of Cataract Canyon.

USGS intern prepares geophysical equipment
In this photo, USGS intern Brett Trottier (right) is learning how to prepare and deploy geophysical equipment from USGS hydrologist Eric White (left). The towed transient electromagnetic (tTEM) system is used to map the shallow subsurface to help us understand geologic and hydrogeologic conditions.
In this photo, USGS intern Brett Trottier (right) is learning how to prepare and deploy geophysical equipment from USGS hydrologist Eric White (left). The towed transient electromagnetic (tTEM) system is used to map the shallow subsurface to help us understand geologic and hydrogeologic conditions.

Two hydrologic technicians kayaking to collect samples
Two hydrologic technicians kayaking to collect samplesHydrologic Technicians, Michael Willis and Rogelio Hernandez kayaking on the Rio Grande to collect samples prior to herbicide treatment on invasive Arundo Cane.
Two hydrologic technicians kayaking to collect samples
Two hydrologic technicians kayaking to collect samplesHydrologic Technicians, Michael Willis and Rogelio Hernandez kayaking on the Rio Grande to collect samples prior to herbicide treatment on invasive Arundo Cane.

USGS employee collects water quality data on shore alongside boat
USGS employee collects water quality data on shore alongside boatA USGS employee collecting data for the Lake Tahoe Nearshore Nutrient Source Identification Project.