
A sailboat is removed from the Great Salt Lake Marina due to low lake levels.
Images
Explore water-related photography, imagery, and illustrations.
Filter Total Items: 2560

Great Salt Lake Reaches New Historic Low
A sailboat is removed from the Great Salt Lake Marina due to low lake levels.

Great Salt Lake May Reach Historic Low Soon
Decreasing water levels in the southern arm of the Great Salt Lake expose microbialite communities that are normally underwater.
Decreasing water levels in the southern arm of the Great Salt Lake expose microbialite communities that are normally underwater.

June 2021 USGS Active Groundwater Level Network Animation
June 2021 USGS Active Groundwater Level Network AnimationThe USGS Active Groundwater Level Network includes about 20,000 wells that have been measured by the USGS or USGS cooperators at least once within the past 13 months. The animation shows snapshots of daily water-level statistics in the network for June 2021.

Climate station locations, U.S. Environmental Protection Agency (EPA)-defined North America Level III ecoregions (ecoregions), and California Department of Water Resources (CDWR) full natural flow (FNF) hydrological basins.
Climate station locations, U.S. Environmental Protection Agency (EPA)-defined North America Level III ecoregions (ecoregions), and California Department of Water Resources (CDWR) full natural flow (FNF) hydrological basins.FIG. 1. Study area, climate station locations, U.S. Environmental Protection Agency (EPA)-defined North America Level III ecoregions (ecoregions), and California Department of Water Resources (CDWR) full natural flow (FNF) hydrological basins.
Climate station locations, U.S. Environmental Protection Agency (EPA)-defined North America Level III ecoregions (ecoregions), and California Department of Water Resources (CDWR) full natural flow (FNF) hydrological basins.
Climate station locations, U.S. Environmental Protection Agency (EPA)-defined North America Level III ecoregions (ecoregions), and California Department of Water Resources (CDWR) full natural flow (FNF) hydrological basins.Climate station locations, U.S. Environmental Protection Agency (EPA)-defined North America Level III ecoregions (ecoregions), and California Department of Water Resources (CDWR) full natural flow (FNF) hydrological basins.
Climate station locations, U.S. Environmental Protection Agency (EPA)-defined North America Level III ecoregions (ecoregions), and California Department of Water Resources (CDWR) full natural flow (FNF) hydrological basins.FIG. 1. Study area, climate station locations, U.S. Environmental Protection Agency (EPA)-defined North America Level III ecoregions (ecoregions), and California Department of Water Resources (CDWR) full natural flow (FNF) hydrological basins.

Lees Ferry streamgage and cableway on the Colorado River, Arizona
Lees Ferry streamgage and cableway on the Colorado River, ArizonaLees Ferry streamgage and cableway downstream on the Colorado River, Arizona
Lees Ferry streamgage and cableway on the Colorado River, Arizona
Lees Ferry streamgage and cableway on the Colorado River, ArizonaLees Ferry streamgage and cableway downstream on the Colorado River, Arizona

Hydrologists measuring gradient self-potential, water temperature, specific conductance, and nitrate concentrations in the upper Delaware River between Hancock and Port Jervis, New York.
Hydrologists measuring gradient self-potential, water temperature, specific conductance, and nitrate concentrations in the upper Delaware River between Hancock and Port Jervis, New York.Photograph of hydrologists measuring gradient self-potential, water temperature, specific conductance, and nitrate concentrations were measured along a 123 km reach in the upper Delaware River between Hancock and Port Jervis, New York in summer 2021. Data collected during this campaign are available at: https://doi.org
Hydrologists measuring gradient self-potential, water temperature, specific conductance, and nitrate concentrations in the upper Delaware River between Hancock and Port Jervis, New York.
Hydrologists measuring gradient self-potential, water temperature, specific conductance, and nitrate concentrations in the upper Delaware River between Hancock and Port Jervis, New York.Hydrologists measuring gradient self-potential, water temperature, specific conductance, and nitrate concentrations in the upper Delaware River between Hancock and Port Jervis, New York.
Hydrologists measuring gradient self-potential, water temperature, specific conductance, and nitrate concentrations in the upper Delaware River between Hancock and Port Jervis, New York.Photograph of hydrologists measuring gradient self-potential, water temperature, specific conductance, and nitrate concentrations were measured along a 123 km reach in the upper Delaware River between Hancock and Port Jervis, New York in summer 2021. Data collected during this campaign are available at: https://doi.org
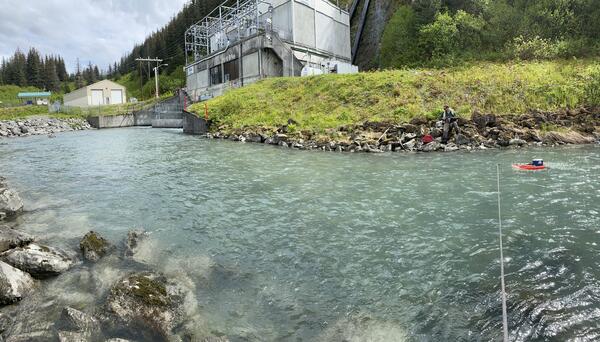
Solomon Gulch
USGS staff measuring discharge at the Solomon Gulch Hydropower tailrace, Valdez Alaska.
USGS staff measuring discharge at the Solomon Gulch Hydropower tailrace, Valdez Alaska.

Rain Gauge installed after Grizzly Creek fire
Rain Gauge installed after the 2020 Grizzly Creek fire in Glenwood Canyon, Colorado. Scientists installed a network of rain gauges and soil moisture sensors throughout the rugged burn area. These instruments provide real-time data on rainfall intensity and duration, which are critical factors in determining the likelihood of a debris flow.
Rain Gauge installed after the 2020 Grizzly Creek fire in Glenwood Canyon, Colorado. Scientists installed a network of rain gauges and soil moisture sensors throughout the rugged burn area. These instruments provide real-time data on rainfall intensity and duration, which are critical factors in determining the likelihood of a debris flow.
May 2021 USGS Active Groundwater Level Network Animation
May 2021 USGS Active Groundwater Level Network AnimationThe USGS Active Groundwater Level Network includes about 20,000 wells that have been measured by the USGS or USGS cooperators at least once within the past 13 months. The animation shows a daily snapshot of water-level statistics in the network for May 2021.

Remote control ADCP measurement
The Region 1, May 2021 "USGS at Work" Winner (by Aaron Stephens)
The Region 1, May 2021 "USGS at Work" Winner (by Aaron Stephens)

Upstream view from 03108000 - Raccoon Creek at Moffatts Mill, PA
Upstream view from 03108000 - Raccoon Creek at Moffatts Mill, PAThe Region 1, May 2021 "Where We Work" Winner (by Ian Lynch)
Upstream view from 03108000 - Raccoon Creek at Moffatts Mill, PA
Upstream view from 03108000 - Raccoon Creek at Moffatts Mill, PAThe Region 1, May 2021 "Where We Work" Winner (by Ian Lynch)

Rappahannock River Cableway Sampling
The Region 1, May 2021 "Honorable Mention #1" Winner (by Chelsea Delsack)
The Region 1, May 2021 "Honorable Mention #1" Winner (by Chelsea Delsack)

Water Sampling for PFAS
A USGS scientist wearing black gloves is collecting a sample of tap water from the kitchen sink using small plastic vials to test for PFAS.
A USGS scientist wearing black gloves is collecting a sample of tap water from the kitchen sink using small plastic vials to test for PFAS.

Colorado River near Canyonlands National Park
Colorado River outside of Canyonlands National Park, La Sal Mountains in the background.
Colorado River outside of Canyonlands National Park, La Sal Mountains in the background.

April 2021 USGS Active Groundwater Level Network Animation
April 2021 USGS Active Groundwater Level Network AnimationThe USGS Active Groundwater Level Network includes about 20,000 wells that have been measured by the USGS or USGS cooperators at least once within the past 13 months. The animation shows a daily snapshot of water-level statistics in the network for April 2021.


From Snow to Flow data viz story (carousel)
This illustration is part of the From Snow to Flow data visualization story.
This illustration is part of the From Snow to Flow data visualization story.

Laser Flow in Storm Drain at Hampton Coliseum
The Region 1, April 2021 "Honorable Mention #1" Winner (by Chelsea Delsack)
The Region 1, April 2021 "Honorable Mention #1" Winner (by Chelsea Delsack)

USGS scientist measures groundwater level in irrigation well
USGS scientist measures groundwater level in irrigation wellIn this photo, USGS scientist Julia David is taking field notes while out measuring groundwater levels in an irrigation well in the Walla Walla River Basin in April 2021.
USGS scientist measures groundwater level in irrigation well
USGS scientist measures groundwater level in irrigation wellIn this photo, USGS scientist Julia David is taking field notes while out measuring groundwater levels in an irrigation well in the Walla Walla River Basin in April 2021.

Shelton Produced Water Field Sampling
The Region 1, April 2021 "Honorable Mention #2" Winner (by Bonnie McDevitt)
The Region 1, April 2021 "Honorable Mention #2" Winner (by Bonnie McDevitt)

Mooring Recovery in Cape Cod Bay, MA
The Region 1, April 2021 "USGS at Work" Winner (by Alex Olson)
The Region 1, April 2021 "USGS at Work" Winner (by Alex Olson)