



Hurricane Isaias made landfall near Destin, Florida as a Category 2 storm on October 9, 2026. Tracking inland through Alabama, its remnants brought damaging winds, heavy rainfall, flash flooding, and life-threatening storm surge from the Gulf Coast to the southern Appalachians and Mid-Atlantic.
Videos
Explore videos related to water science and products.
Filter Total Items: 484
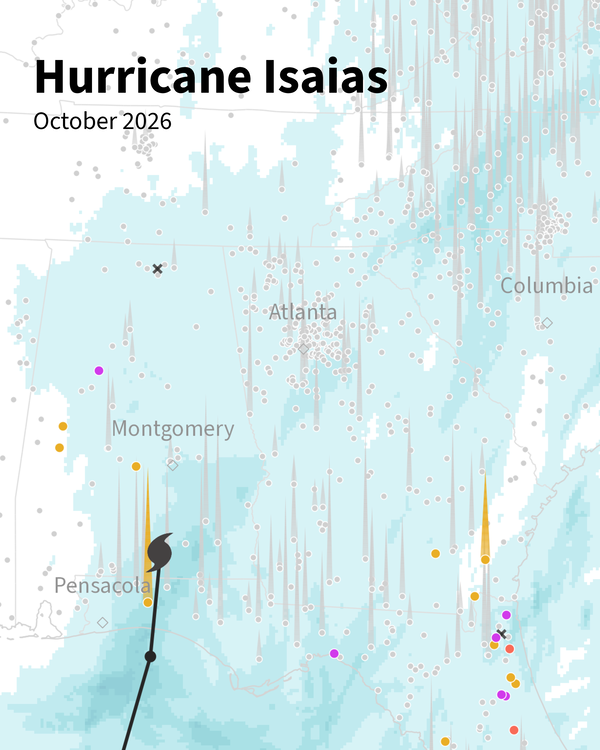
Hurricane Isaias Animation from USGS Vizlab
Hurricane Isaias made landfall near Destin, Florida as a Category 2 storm on October 9, 2026. Tracking inland through Alabama, its remnants brought damaging winds, heavy rainfall, flash flooding, and life-threatening storm surge from the Gulf Coast to the southern Appalachians and Mid-Atlantic.
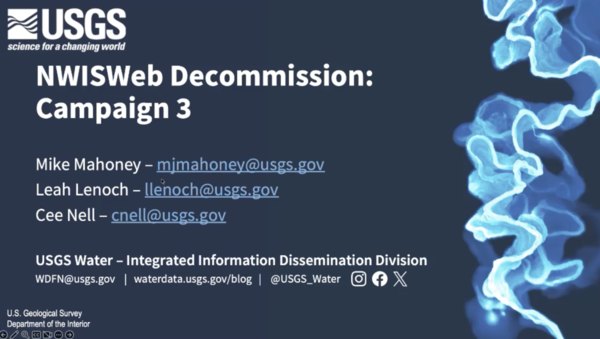
Water Data for the Nation - NWISWeb Decommissioning Webinar - Oct 2026
Water Data for the Nation - NWISWeb Decommissioning Webinar - Oct 2026This recording of a public webinar highlights new features of Water Data for the Nation (WDFN) and the NWISWeb decommissioning effort.
Water Data for the Nation - NWISWeb Decommissioning Webinar - Oct 2026
Water Data for the Nation - NWISWeb Decommissioning Webinar - Oct 2026This recording of a public webinar highlights new features of Water Data for the Nation (WDFN) and the NWISWeb decommissioning effort.

Hurricane Helene Animation from USGS Vizlab
Hurricane Helene made landfall in Florida as a Category 4 storm on September 26, 2024, bringing historic rainfall and catastrophic flooding across the Southeast. This animation tracks hourly precipitation and streamflow at USGS streamgages along Helene's path (Sep 24–29, 2024).
Hurricane Helene made landfall in Florida as a Category 4 storm on September 26, 2024, bringing historic rainfall and catastrophic flooding across the Southeast. This animation tracks hourly precipitation and streamflow at USGS streamgages along Helene's path (Sep 24–29, 2024).
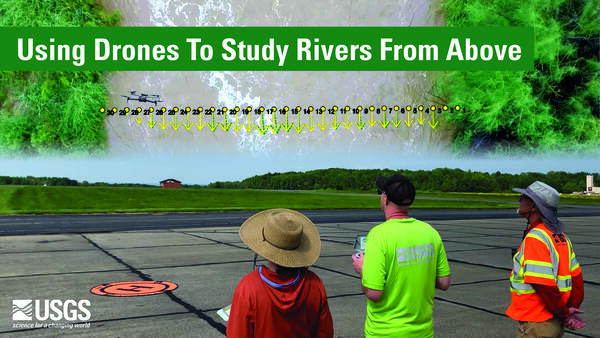
Using Drones To Study Rivers From Above
The Next Generation Water Observing Program (NGWOS) supports the advancement of water resources observations in order to assess water availability, management, and prediction across the US’s major hydrologic regions.
The Next Generation Water Observing Program (NGWOS) supports the advancement of water resources observations in order to assess water availability, management, and prediction across the US’s major hydrologic regions.
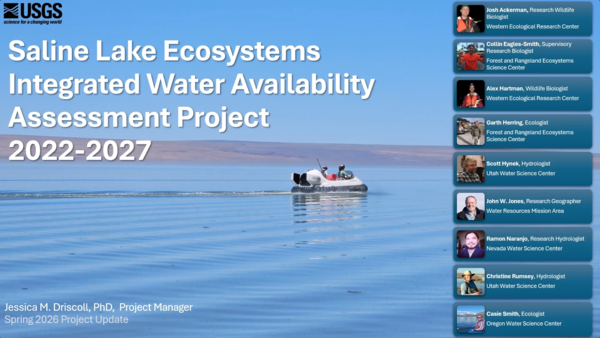
Saline Lake Ecosystems IWAA Spring Seminar: Project Updates and 2026 Field Season Plans
Saline Lake Ecosystems IWAA Spring Seminar: Project Updates and 2026 Field Season PlansThis video presents the Spring 2026 Saline Lake Ecosystems Integrated Water Availability Assessment Spring Seminar by the U.S. Geological Survey (USGS). Narrated by Lisa Hoaks, the seminar provides project updates, summer 2026 field season plans, and recently published products.
Saline Lake Ecosystems IWAA Spring Seminar: Project Updates and 2026 Field Season Plans
Saline Lake Ecosystems IWAA Spring Seminar: Project Updates and 2026 Field Season PlansThis video presents the Spring 2026 Saline Lake Ecosystems Integrated Water Availability Assessment Spring Seminar by the U.S. Geological Survey (USGS). Narrated by Lisa Hoaks, the seminar provides project updates, summer 2026 field season plans, and recently published products.
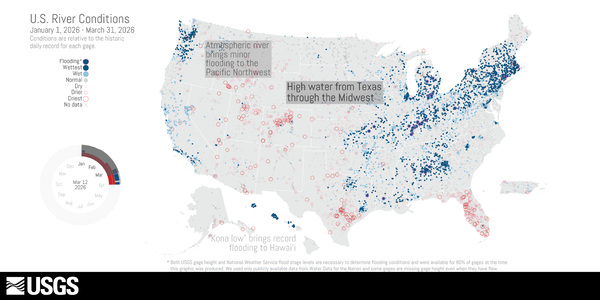
U.S. River Conditions, January to March 2026
January to March 2026

Rusting Rivers B-Roll: Kugururok River, Alaska
This is B-roll video of the Kugururok River, Noatak National Preserve, Alaska from August 30, 2025.
This is B-roll video of the Kugururok River, Noatak National Preserve, Alaska from August 30, 2025.
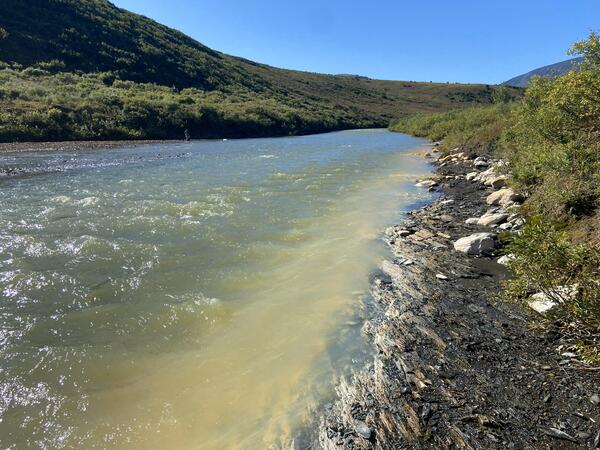
Rusting Rivers B-Roll: Anatok Creek, Alaska
This is B-roll video of Anatok Creek, Kobuk Valley National Park, Alaska from August 19, 2025.
This is B-roll video of Anatok Creek, Kobuk Valley National Park, Alaska from August 19, 2025.
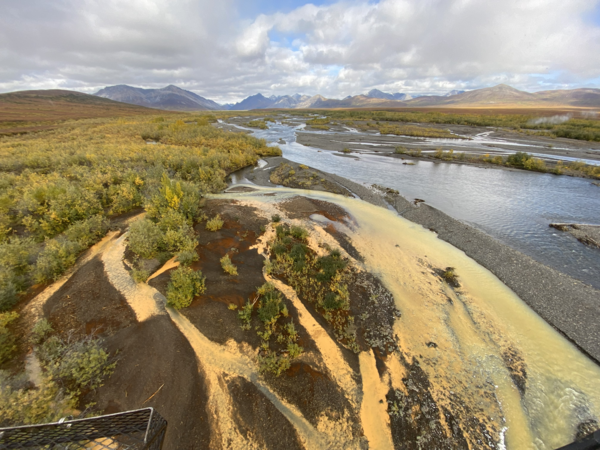
Rusting Rivers: Heavy Metals and Visible Color Changes
Rusting Rivers: Heavy Metals and Visible Color ChangesRusting rivers are increasingly common in the Brooks Range of northern Alaska. The orange stream color reflects oxidized iron (hence the appearance of rusting), but orange color also indicates elevated heavy metal concentrations and impaired water quality.
Rusting Rivers: Heavy Metals and Visible Color Changes
Rusting Rivers: Heavy Metals and Visible Color ChangesRusting rivers are increasingly common in the Brooks Range of northern Alaska. The orange stream color reflects oxidized iron (hence the appearance of rusting), but orange color also indicates elevated heavy metal concentrations and impaired water quality.

Water Data for the Nation - New Features and NWISWeb Decommissioning Webinar
Water Data for the Nation - New Features and NWISWeb Decommissioning WebinarThis recording of a public webinar highlights new features of Water Data for the Nation (WDFN) and the NWISWeb decommissioning effort.
Water Data for the Nation - New Features and NWISWeb Decommissioning Webinar
Water Data for the Nation - New Features and NWISWeb Decommissioning WebinarThis recording of a public webinar highlights new features of Water Data for the Nation (WDFN) and the NWISWeb decommissioning effort.
New Modeled Water Data: Data Companion Release January 2026
New Modeled Water Data: Data Companion Release January 2026This recorded webinar demonstrates how to access and use new modeled water data delivered through the National Water Availability Assessment Data Companion (NWDC). The NWDC is a centralized website providing USGS model-derived water availability, supply, and use information that underlies the National Water Availability Assessment Report.
New Modeled Water Data: Data Companion Release January 2026
New Modeled Water Data: Data Companion Release January 2026This recorded webinar demonstrates how to access and use new modeled water data delivered through the National Water Availability Assessment Data Companion (NWDC). The NWDC is a centralized website providing USGS model-derived water availability, supply, and use information that underlies the National Water Availability Assessment Report.
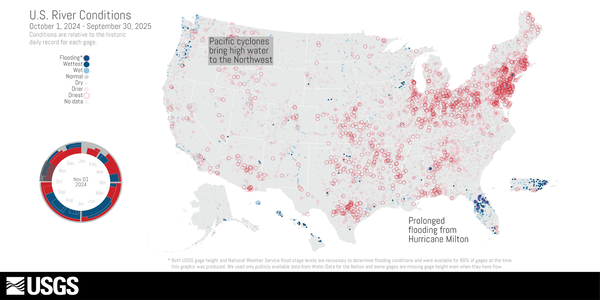
U.S. River Conditions, Water Year 2025
This is an animation showing the changing conditions relative to the historic record of USGS streamgages from October 1, 2024 - September 30, 2025. The river conditions shown range from the driest condition seen at a gage (red open circles) to the wettest (blue closed circles). A purple outer ring around a gage indicates it is flooding.
This is an animation showing the changing conditions relative to the historic record of USGS streamgages from October 1, 2024 - September 30, 2025. The river conditions shown range from the driest condition seen at a gage (red open circles) to the wettest (blue closed circles). A purple outer ring around a gage indicates it is flooding.
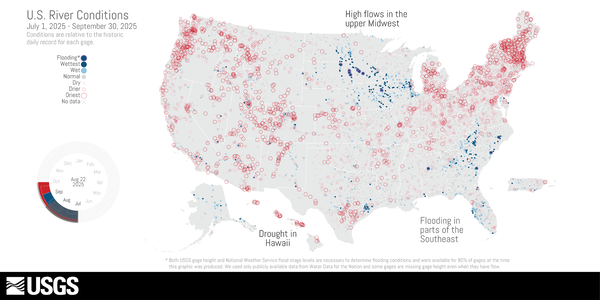
U.S. River Conditions, July to September 2025
This is an animation showing the changing conditions relative to the historic record of USGS streamgages from July 1, 2025, to September 30, 2025. The river conditions shown range from the driest condition seen at a gage (red open circles) to the wettest (blue closed circles). A purple outer ring around a gage indicates it is flooding.
This is an animation showing the changing conditions relative to the historic record of USGS streamgages from July 1, 2025, to September 30, 2025. The river conditions shown range from the driest condition seen at a gage (red open circles) to the wettest (blue closed circles). A purple outer ring around a gage indicates it is flooding.
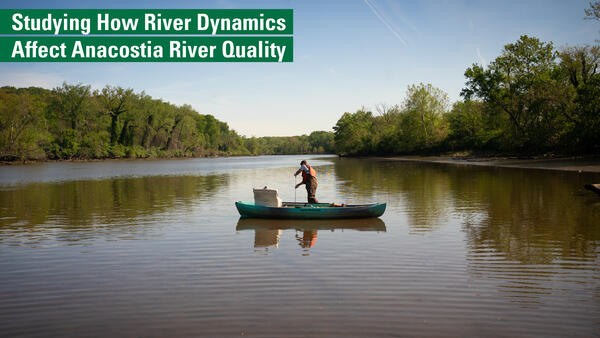
Studying Anacostia River Quality with DOEE
The USGS and D.C.’s DOEE have been working together to monitor water quality in the Anacostia, in support of the District's goal of expanding access to the water for local communities. DOEE relies on data and continuous monitoring from USGS to support important decisions about public safety and the accessibility of the area’s natural resources.
The USGS and D.C.’s DOEE have been working together to monitor water quality in the Anacostia, in support of the District's goal of expanding access to the water for local communities. DOEE relies on data and continuous monitoring from USGS to support important decisions about public safety and the accessibility of the area’s natural resources.
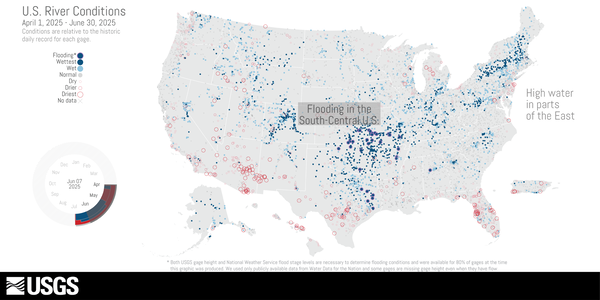
U.S. River Conditions, April to June 2025
This is an animation showing the changing conditions relative to the historic record of USGS streamgages from April 1, 2025 to June 30, 2025. The river conditions shown range from the driest condition seen at a gage (red open circles) to the wettest (blue closed circles). A purple outer ring around a gage indicates it is flooding.
This is an animation showing the changing conditions relative to the historic record of USGS streamgages from April 1, 2025 to June 30, 2025. The river conditions shown range from the driest condition seen at a gage (red open circles) to the wettest (blue closed circles). A purple outer ring around a gage indicates it is flooding.
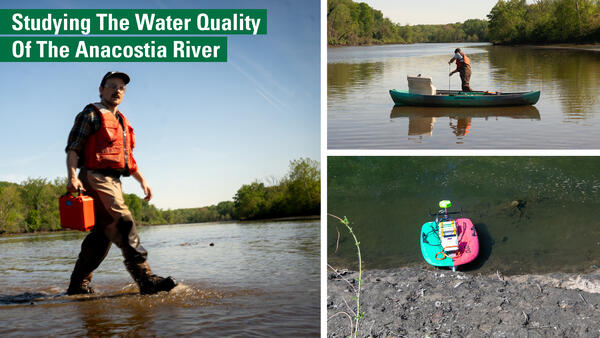
Studying the Water Quality of the Anacostia River
The USGS and D.C.’s DOEE have been working together to monitor water quality in the Anacostia, in support of the District's goal of expanding access to the water for local communities. DOEE relies on data and continuous monitoring from USGS to support important decisions about public safety and the accessibility of the area’s natural resources.
The USGS and D.C.’s DOEE have been working together to monitor water quality in the Anacostia, in support of the District's goal of expanding access to the water for local communities. DOEE relies on data and continuous monitoring from USGS to support important decisions about public safety and the accessibility of the area’s natural resources.
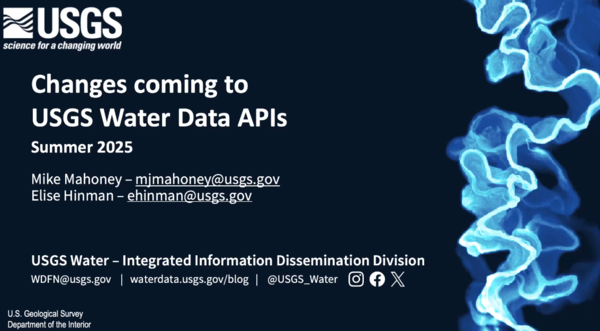
Modernized USGS Water Data Application Programming Interfaces (APIs)
Modernized USGS Water Data Application Programming Interfaces (APIs)For over 15 years, the USGS has provided machine-readable and automated access to water data via the WaterServices family of APIs.
Modernized USGS Water Data Application Programming Interfaces (APIs)
Modernized USGS Water Data Application Programming Interfaces (APIs)For over 15 years, the USGS has provided machine-readable and automated access to water data via the WaterServices family of APIs.

Your Future at USGS: Discover the MD-DE-DC Water Science Center
Your Future at USGS: Discover the MD-DE-DC Water Science CenterDiscover what a career in science with the U.S. Geological Survey looks like. The Maryland-Delaware-DC Water Science Center is home to skilled scientists of many disciplines: hydrologists, geomorphologists, geographers, data scientists, statisticians, biologists, technicians, and more. You name it, we need it.
Your Future at USGS: Discover the MD-DE-DC Water Science Center
Your Future at USGS: Discover the MD-DE-DC Water Science CenterDiscover what a career in science with the U.S. Geological Survey looks like. The Maryland-Delaware-DC Water Science Center is home to skilled scientists of many disciplines: hydrologists, geomorphologists, geographers, data scientists, statisticians, biologists, technicians, and more. You name it, we need it.
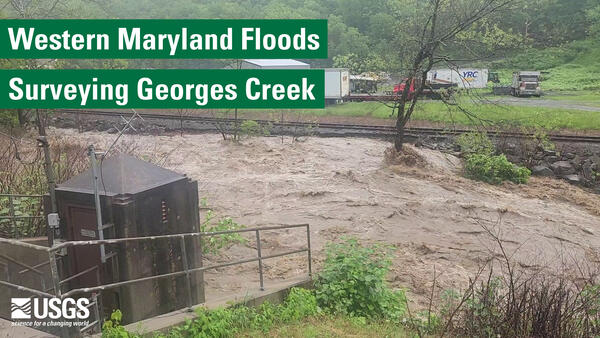
USGS On the Road - Flooding in Westernport, MD
Westernport, Maryland was one of the hardest hit towns during the mid-May flooding in Western Maryland, where Georges Creek flooded an elementary school in Westernport, MD, prompting the emergency rescue of schoolchildren.
Westernport, Maryland was one of the hardest hit towns during the mid-May flooding in Western Maryland, where Georges Creek flooded an elementary school in Westernport, MD, prompting the emergency rescue of schoolchildren.

U.S. River Conditions, January to March 2025
This is an animation showing the changing conditions relative to the historic record of USGS streamgages from January 1, 2025 to March 31, 2025. The river conditions shown range from the driest condition seen at a gage (red open circles) to the wettest (blue closed circles). A purple outer ring around a gage indicates it is flooding.
This is an animation showing the changing conditions relative to the historic record of USGS streamgages from January 1, 2025 to March 31, 2025. The river conditions shown range from the driest condition seen at a gage (red open circles) to the wettest (blue closed circles). A purple outer ring around a gage indicates it is flooding.

Lesson 10j1 - Importing and Visualizing 3DEP Point Cloud Data with QGIS
Lesson 10j1 - Importing and Visualizing 3DEP Point Cloud Data with QGISThis National Map training video will demonstrate how to use QGIS, a free and open-source GIS software, to import and visualize lidar point cloud data from the USGS 3D Elevation Program (3DEP).
Lesson 10j1 - Importing and Visualizing 3DEP Point Cloud Data with QGIS
Lesson 10j1 - Importing and Visualizing 3DEP Point Cloud Data with QGISThis National Map training video will demonstrate how to use QGIS, a free and open-source GIS software, to import and visualize lidar point cloud data from the USGS 3D Elevation Program (3DEP).