
The Mojave River is the largest of the streams and rivers that flow through southwestern San Bernardino County, CA. It extends more than 100 miles east from its source in the San Bernardino Mountains to the end east of Afton Canyon. This 3D animation takes the viewer on a tour of the entire length of the river.
All Multimedia
Access all multimedia to include images, video, audio, webcams, before-after imagery, and more. Filter and explore with filtering options to refine search.
Filter Total Items: 24923

The Mojave River: A 3D Journey
The Mojave River is the largest of the streams and rivers that flow through southwestern San Bernardino County, CA. It extends more than 100 miles east from its source in the San Bernardino Mountains to the end east of Afton Canyon. This 3D animation takes the viewer on a tour of the entire length of the river.

Beach profile data collection near a sea turtle nest
Beach profile data collection near a sea turtle nestScientists RC Mickey and Dave Thompson from the USGS St.
Beach profile data collection near a sea turtle nest
Beach profile data collection near a sea turtle nestScientists RC Mickey and Dave Thompson from the USGS St.

Gerry Hatcher controls SQUID-5
Gerry Hatcher controls SQUID-5 image acquisition over Looe Key Sanctuary Preservation Area (SPA).
Gerry Hatcher controls SQUID-5 image acquisition over Looe Key Sanctuary Preservation Area (SPA).


Pacific pocket mouse
Once thought to be extinct, the Pacific pocket mouse (Perognathus longimembris pacificus) was rediscovered in 1993 and is currently found at three population sites along the southern California coast.
Once thought to be extinct, the Pacific pocket mouse (Perognathus longimembris pacificus) was rediscovered in 1993 and is currently found at three population sites along the southern California coast.

Elongate amphiboles_asbestiform
Scanning electron microscope image of elongate amphiboles, some of which are asbestiform, collected from attic insulation from Libby, Montana.
Scanning electron microscope image of elongate amphiboles, some of which are asbestiform, collected from attic insulation from Libby, Montana.

NOAA-USGS Stepping Stones 2021 Expedition
Join USGS researchers Jason Chaytor and Kira Mizell as they virtually participate in a NOAA Ocean Exploration expedition to the depths of the North Atlantic.
Join USGS researchers Jason Chaytor and Kira Mizell as they virtually participate in a NOAA Ocean Exploration expedition to the depths of the North Atlantic.

NOAA-USGS Stepping Stones 2021 Expedition - AD
Join USGS researchers Jason Chaytor and Kira Mizell as they virtually participate in a NOAA Ocean Exploration expedition to the depths of the North Atlantic.
Join USGS researchers Jason Chaytor and Kira Mizell as they virtually participate in a NOAA Ocean Exploration expedition to the depths of the North Atlantic.

Earth as Art 2
The Earth As Art project began in the early 2000s, and its original intent remains the same: to produce images that do not look like satellite images at first glance.
The Earth As Art project began in the early 2000s, and its original intent remains the same: to produce images that do not look like satellite images at first glance.

Earth as Art 2 - AD
The Earth As Art project began in the early 2000s, and its original intent remains the same: to produce images that do not look like satellite images at first glance.
The Earth As Art project began in the early 2000s, and its original intent remains the same: to produce images that do not look like satellite images at first glance.

Eyes on Earth Episode 54 - National Land Cover Database 2019
Eyes on Earth Episode 54 - National Land Cover Database 2019The National Land Cover Database, or NLCD, was the first and remains the most well-known set of satellite-based land cover mapping products released by EROS. It sorts the each 30-by-30-meter plot of land in the United States into a land cover class, such as cropland, pasture, high-intensity developed, deciduous forest, and the like.

Yaquina Bay, Newport, Oregon
Marcus G. Langseth departs Newport, Oregon (Yaquina Bay) for Cascadia Project OBS Deployment Leg
Marcus G. Langseth departs Newport, Oregon (Yaquina Bay) for Cascadia Project OBS Deployment Leg

Geologic block-diagram and conceptual model of Mammoth Hot Springs
Geologic block-diagram and conceptual model of Mammoth Hot SpringsGeologic block-diagram and conceptual model of possible flow systems associated with thermal areas at Mammoth Hot Spring (MHS) area from Sorey (1991) (USGS Water-Resources Investigations Report 91-4052). Also shown are the Bear Creek Hot Springs (BC) and La Duke Hot Spring (LD).


Halema‘uma‘u observations — July 9, 2021
A Hawaiian Volcano Observatory geologist uses a laser rangefinder to survey points across the solidified lava lake surface in Halema‘uma‘u, at the summit of Kīlauea. No significant changes in lake surface elevation have been observed in recent weeks. USGS photo by M. Patrick taken on July 9, 2021.
A Hawaiian Volcano Observatory geologist uses a laser rangefinder to survey points across the solidified lava lake surface in Halema‘uma‘u, at the summit of Kīlauea. No significant changes in lake surface elevation have been observed in recent weeks. USGS photo by M. Patrick taken on July 9, 2021.

Earthquake Briefing — The Antelope Valley, CA Earthquake, July 8, 2021
Earthquake Briefing — The Antelope Valley, CA Earthquake, July 8, 2021Earthquake Briefing with Austin Elliot, USGS on the Antelope Valley, CA earthquake that occurred on July 8, 2021.
Earthquake Briefing — The Antelope Valley, CA Earthquake, July 8, 2021
Earthquake Briefing — The Antelope Valley, CA Earthquake, July 8, 2021Earthquake Briefing with Austin Elliot, USGS on the Antelope Valley, CA earthquake that occurred on July 8, 2021.

Great Salt Lake May Reach Historic Low Soon
Decreasing water levels in the southern arm of the Great Salt Lake expose microbialite communities that are normally underwater.
Decreasing water levels in the southern arm of the Great Salt Lake expose microbialite communities that are normally underwater.

Little Snake River near Dixon low streamflow
Little Snake River near Dixon low streamflow

Low Flows at Little Snake River near Dixon streamgage
Low Flows at Little Snake River near Dixon streamgageLow Flows at Little Snake River near Dixon streamgage
Low Flows at Little Snake River near Dixon streamgage
Low Flows at Little Snake River near Dixon streamgageLow Flows at Little Snake River near Dixon streamgage

Salt lick and device to exclude wildlife from access to minerals
Salt lick and device to exclude wildlife from access to mineralsOrange and black excluder device (left) will contain minerals, but intended to allow livestock access while excluding wildlife. Mineral block to the right of excluder device.
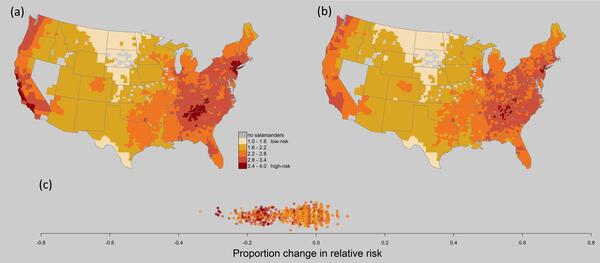
Maps of Bsal risk in the U.S. comparing pre- and post- action risk
Maps of Bsal risk in the U.S. comparing pre- and post- action riskRelative risk maps of combined Bsal risk, comparing (a) pre-action risk (2010–2015), to (b) risk after implementation of surveillance and of importation restrictions on over 200 salamander species. Relative risk scores were scaled to 2010–2015. (c) Change in relative risk score per county as proportion of pre-action risk.