
USGS scientist Janet Watt making a shear vane measurement on a gravity core to understand how the seafloor responds to earthquake shaking.
Images
Explore our planet through photography and imagery, including climate change and water all the way back to the 1800s when the USGS was surveying the country by horse and buggy.
Filter Total Items: 21357

Making a shear vane measurement on a gravity core
USGS scientist Janet Watt making a shear vane measurement on a gravity core to understand how the seafloor responds to earthquake shaking.

Members of the Kotlik (Querrullik) governance
Various members of the Kotlik (Querrullik) governance talking about environmental changes for the Building Resilience Project.
Various members of the Kotlik (Querrullik) governance talking about environmental changes for the Building Resilience Project.

Preparing the jumbo piston corer
USGS marine technician Jenny McKee prepares the jumbo piston corer for launching off research vessel Bold Horizon off the coast of California and Oregon. The corer will collect sediment samples from the seafloor. Scientists will examine the sediment to determine its age, character, and distribution. This area off the west coast of the U.S.
USGS marine technician Jenny McKee prepares the jumbo piston corer for launching off research vessel Bold Horizon off the coast of California and Oregon. The corer will collect sediment samples from the seafloor. Scientists will examine the sediment to determine its age, character, and distribution. This area off the west coast of the U.S.

Taking Active Layer Network measurements, Alaska
Malinda Chase (AK CASC Tribal Liaison), Jeremy Littell (AK CASC Lead Scientist), Victor Tonuchuk, Jr., Philomena Keyes, and Bernard TKTKTK taking Active Layer Network measurements in Kotlik, Alaska.
Malinda Chase (AK CASC Tribal Liaison), Jeremy Littell (AK CASC Lead Scientist), Victor Tonuchuk, Jr., Philomena Keyes, and Bernard TKTKTK taking Active Layer Network measurements in Kotlik, Alaska.
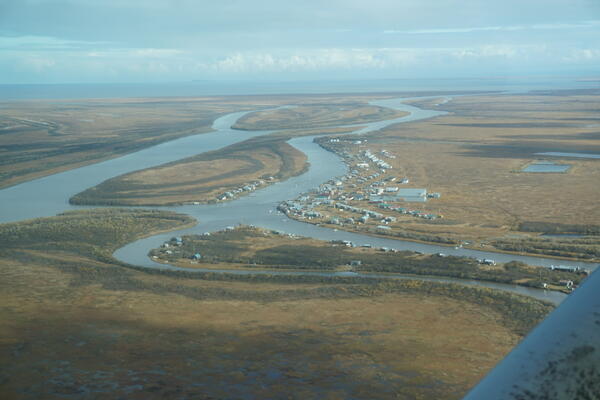
The governance of Kotlik (Querrullik), Alaska
The governance of Kotlik (Querrullik) in Alaska.
The governance of Kotlik (Querrullik) in Alaska.

Santa Barbara survey
Goleta Beach in Santa Barbara experienced an unusual storm and large wave event in the Spring of 2014. Gaviota Pier, seen far off in the background, sustained heavy damage as did the restaurants on the pier and nearby. The USGS conducts seasonal surveys throught the year to see how the beaches are changing through time.
Goleta Beach in Santa Barbara experienced an unusual storm and large wave event in the Spring of 2014. Gaviota Pier, seen far off in the background, sustained heavy damage as did the restaurants on the pier and nearby. The USGS conducts seasonal surveys throught the year to see how the beaches are changing through time.

Finley, a female Kemp's ridley sea turtle
A female Kemp's ridley sea turtle, named Finley, shows off the popoff ADL (orange) and satellite tag (blue).
A female Kemp's ridley sea turtle, named Finley, shows off the popoff ADL (orange) and satellite tag (blue).

Pondering the pond: what Halema‘uma‘u water chemistry tells us
Pondering the pond: what Halema‘uma‘u water chemistry tells usUSGS Hawaiian Volcano Observatory and DOI Office of Aviation staff prepare the sampling mechanism (on blue tarp) and inspect the Unmanned Aircraft System (UAS) just before it took off to collect water from the Halema‘uma‘u crater lake. Brightly-colored flagging tape tied to a cable attached to the UAS indicated depth as the sampling tool was lowered into the water.

Pondering the pond: what Halema‘uma‘u water chemistry tells us
Pondering the pond: what Halema‘uma‘u water chemistry tells usWater collected from the lake at the bottom of Halema‘uma‘u is prepared for laboratory analyses at the USGS California Volcano Observatory. Results thus far reveal chemistry indicative of complex reactions between the water, magmatic gases, and Kīlauea's basaltic rocks. USGS photo by S. Peek, October 2019.

Landsat image of Star dunes, Sossusvlei, Namibia.
Star dunes, colored red by iron oxide sand, are seen in this Landsat scene from Sossusvlei in Namibia.
Star dunes, colored red by iron oxide sand, are seen in this Landsat scene from Sossusvlei in Namibia.

Photomicrographs from a wing roll of a little brown bat
Photomicrographs from a wing roll of a little brown batPhotomicrographs from a wing roll of a little brown bat (Myotis lucifugus). PAS. (A) At low magnification, PAS-positive foci are easily detectable. (B) Multifocal cup-shaped ulcers (thick arrow) of the epidermis are scattered over the wing membrane surface. Inflammatory response is lacking.

USGS gage 11451800 Cache Creek at Rumsey, CA

Hawaii State Department of Health updates Ambient Air Quality Data website
Hawaii State Department of Health updates Ambient Air Quality Data websiteThe "Short-term Sulfur Dioxide Advisory Level Information" table (http://www.hiso2index.info/assets/FinalSO2Exposurelevels.pdf) uses a six-tiered color-coded system to depict sulfur dioxide (SO2) concentrations and provide guidance for different groups of people exposed to SO2.

Acquiring marine sediment vibracores in Mississippi Sound
Acquiring marine sediment vibracores in Mississippi SoundScientists collected marine vibracores from a research vessel in Mississippi Sound to study shelf geology as part of a collaboration between Mississippi State University and the USGS St. Petersburg Coastal and Marine Science Center.

Cykl Hydrologiczny, The Natural Water Cycle, Polish
Cykl Hydrologiczny, The Natural Water Cycle, PolishCykl Hydrologiczny, The Natural Water Cycle, Polish
Czym jest cykl hydrologiczny?
Cykl Hydrologiczny, The Natural Water Cycle, Polish
Cykl Hydrologiczny, The Natural Water Cycle, PolishCykl Hydrologiczny, The Natural Water Cycle, Polish
Czym jest cykl hydrologiczny?

Del_Riv_at_Montique
Looking upstream at the Delaware River at Montique (01438500) USGS gage house tower.
Looking upstream at the Delaware River at Montique (01438500) USGS gage house tower.

Still image from November 1, 2019, YVO video monthly update.
Still image from November 1, 2019, YVO video monthly update.Still image from November 1, 2019, YVO video monthly update.
Still image from November 1, 2019, YVO video monthly update.
Still image from November 1, 2019, YVO video monthly update.Still image from November 1, 2019, YVO video monthly update.

Stream gaging in PR after Tropical Storm Karen: finishing the visit
Stream gaging in PR after Tropical Storm Karen: finishing the visitStream gaging in Puerto Rico after Tropical Storm Karen: finishing the visit – Manuel Rosario, with the Caribbean-Florida Water Science Center, walks to the gage house after completing a discharge measurement September 25.

Stream gaging in PR after Tropical Storm Karen: computing gage height
Stream gaging in PR after Tropical Storm Karen: computing gage heightStream gaging in Puerto Rico after Tropical Storm Karen: computing gage height – Manual Rosario does some math required to compute the gage height September 25.
Stream gaging in PR after Tropical Storm Karen: computing gage height
Stream gaging in PR after Tropical Storm Karen: computing gage heightStream gaging in Puerto Rico after Tropical Storm Karen: computing gage height – Manual Rosario does some math required to compute the gage height September 25.

Stream gaging in PR after Tropical Storm Karen: Crest Stage Gage
Stream gaging in PR after Tropical Storm Karen: Crest Stage GageStream gaging in Puerto Rico after Tropical Storm Karen: Crest Stage Gage – The distance of a cork line from a known gage height is measured September 25. The cork line was left on a crest stage gage after a high flow event.

Stream gaging in PR after Tropical Storm Karen: downstream control
Stream gaging in PR after Tropical Storm Karen: downstream controlStream gaging in Puerto Rico after Tropical Storm Karen: downstream control – The pool pictured is almost twice it’s normal size and depth after Tropical Storm Karen passed the island, September 25.