



2026 El Niño: What Does It Mean for Resource Managers?
NOAA and other scientific agencies are forecasting the current El Niño to become very strong over the next 2-9 months—perhaps even the strongest in over 150 years. It’s being called a “Super El Niño” but what does this mean for resource managers?
What Is El Niño?
El Niño is the naturally occurring warm phase of the El Niño-Southern Oscillation (ENSO), a climate pattern in the Pacific Ocean. La Niña is the cool phase of ENSO. During El Niño events, sea surface temperatures in the central and eastern Pacific Ocean near the equator become warmer than average. These events occur every 2–7 years. Some phases are weak, with only slightly elevated temperatures lasting a few months, while others are strong, with much warmer ocean temperatures persisting for 9–12 months. The current El Niño event is shaping up to be particularly strong. An El Niño is classified as “very strong” when sea surface temperatures in the eastern tropical Pacific consistently exceed 2°C above average for several months. In July, ocean temperatures in this region were 2°C to more than 3°C above normal, and additional warming is expected through autumn and early winter.
NOAA Climate Video: Understanding El Niño>>
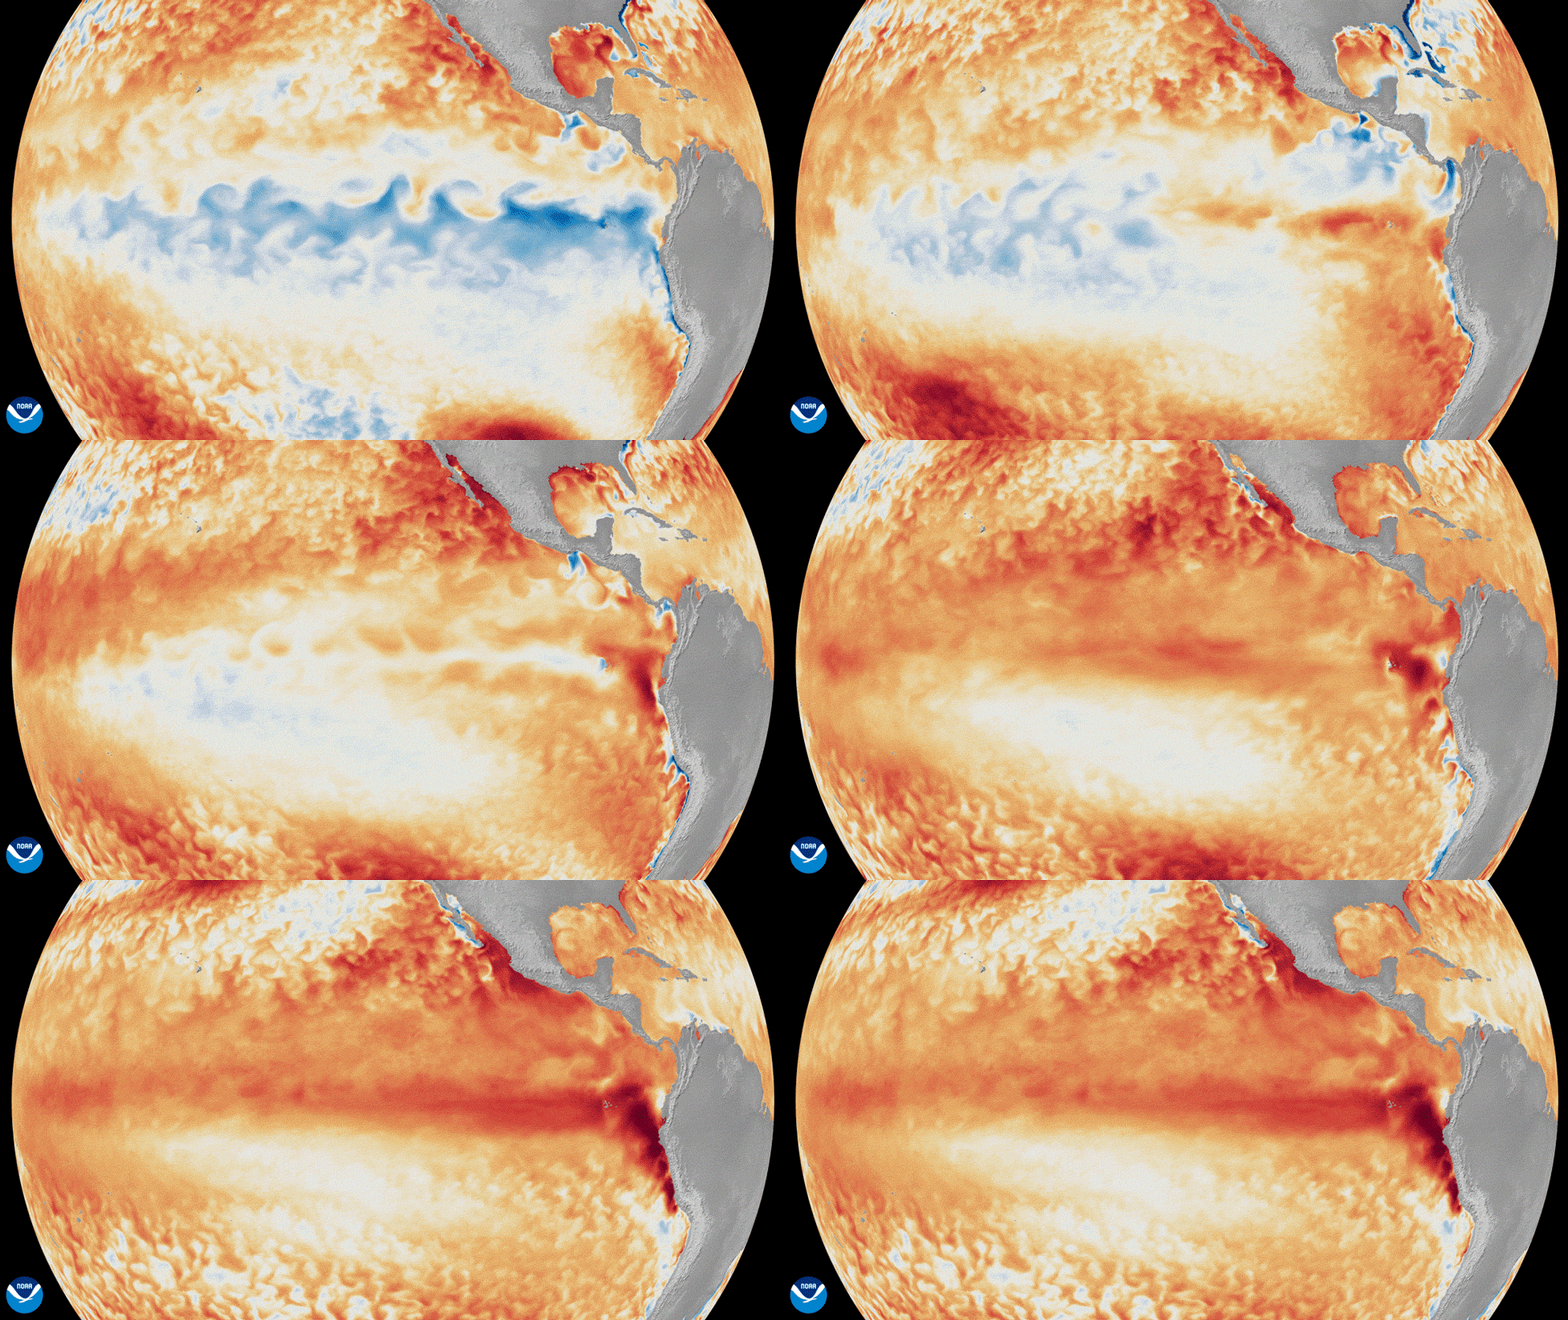
During El Niño, the trade winds that normally blow east to west over the tropical Pacific Ocean weaken or even reverse direction. This causes warmer water to build up in the central and eastern Pacific. As this occurs, rainfall increases over the central and eastern tropical Pacific and decreases over Indonesia. This shift in rainfall and storm activity over such a large area changes regional weather patterns and causes the jet stream (which carries storm systems across North America) to intensify and shift southward. This shift means that some regions of the U.S. are often wetter during El Niño winters, while others are drier.
NOAA Climate News: How El Niño and La Niña affect the winter jet stream and U.S. climate>>
El Niño events vary in strength, and very strong El Niños are sometimes informally labeled “Super El Niños” or, in 2015-2016, “Godzilla El Niño”. A “Super El Niño” doesn’t guarantee that the usual wet/dry patterns will occur, nor that it will be “super wet” or “super dry”. Rather, it shifts the odds towards particular climate conditions for many regions and gives seasonal forecasters more confidence in their predictions for those areas. For decision-making, a very strong El Niño is best understood as shifting the odds of particular climate conditions, rather than determining them. When those odds shift substantially, managers can interpret the change as an increase in specific risks—and, in some cases, opportunities—while recognizing that considerable uncertainty remains and that the expected outcome is not assured.
There have not been many past “Super El Niño” events, which limits our ability to use historical analogues to anticipate the effects of the 2026–2027 El Niño. There have also been differences among the four “Super El Niños” that occurred in recent history. Two events, 1982–1983 and 1997–1998, were classic El Niños in which ocean waters were particularly warm off the coast of South America. Warming during the 1991–1992 and 2015–2016 El Niños extended nearly to the International Dateline, but warming along the western South American coast was relatively modest. There have also been differences in conditions outside of the tropics. For example, during 2015–2016, sea surface temperatures were above normal off both U.S. coasts, and warming in the Pacific Ocean extended to Hawaii and western Alaska. With all of these complexities, scientists rely on the general patterns observed during similar past events, along with sophisticated numerical seasonal forecast models, to anticipate conditions this year and next.
Regional Impacts
Below are the regional impacts that are forecasted and the implications for resource management.
Alaska
Midwest
North Central
Northeast
Northwest
Pacific Islands
South Central
Southeast
Southwest
Additional Resources
El Niño and Snow
El Niño and Hurricanes
For regular updates on this El Niño event and conditions as they emerge, visit: