
Thermal infrared image of two USGS researchers standing on the coastline and looking out (up on the image) over a coastal groundwater plume that is non-visible to the naked eye but can be observed in this thermal image due to the temperature differences between the cooler (blue) groundwater and warmer (pink) ocean water over the coral reefs.
Images
Coastal and Marine Hazards and Resources Program images.
Filter Total Items: 2413

Thermal image of ocean and groundwater
Thermal infrared image of two USGS researchers standing on the coastline and looking out (up on the image) over a coastal groundwater plume that is non-visible to the naked eye but can be observed in this thermal image due to the temperature differences between the cooler (blue) groundwater and warmer (pink) ocean water over the coral reefs.

Lauren Toth and Julie Richey speak to students about climate change
Lauren Toth and Julie Richey speak to students about climate changeThe St. Petersburg Coastal and Marine Science Center hosted a mini panel discussion of scientists for local children to learn about USGS research, capabilities, and techniques for studying changes in climate across Earth’s history.
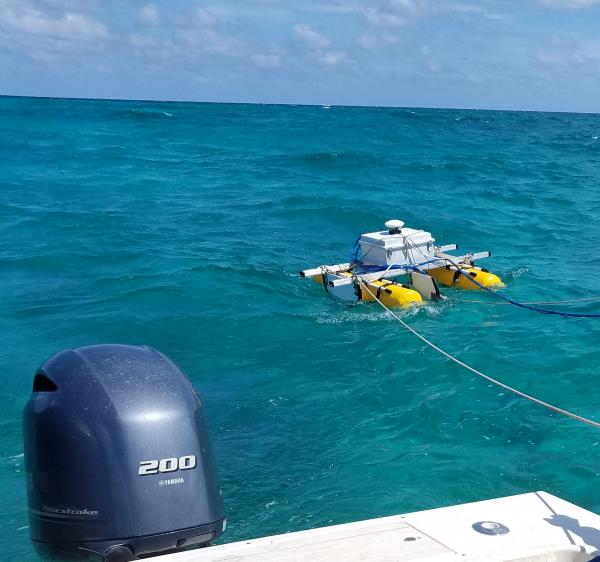
SQUID-5 - Structure-from-Motion Quantitative Underwater Imaging Device
SQUID-5 - Structure-from-Motion Quantitative Underwater Imaging DeviceThe SQUID-5, or a Structure-from-Motion (SfM) Quantitative Underwater Imaging Device with 5 cameras is a towed surface vehicle with an onboard Global Navigation Satellite System (GNSS) and 5 downward-looking cameras with overlapping views of the seafloor.

State of Our Nation’s Coast Stakeholder Engagement Workshop
State of Our Nation’s Coast Stakeholder Engagement WorkshopA group of participants at the Coastal Change Hazards State of Our Nation’s Coast stakeholder engagement workshop at the Waquoit Bay National Estuarine Reserve in Falmouth, MA. Here participants are pictured writing the names of tools they use on sticky notes.

State of Our Nation’s Coast Stakeholder Engagement Workshop
State of Our Nation’s Coast Stakeholder Engagement WorkshopParticipants of the Coastal Change Hazards State of Our Nation’s Coast stakeholder engagement workshop at the Waquoit Bay National Estuarine Reserve in Falmouth, MA. Participants are pictured here talking in small groups.

GOMEX box corer
USGS marine engineering technician Dan Powers from the USGS Pacific Coastal and Marine Science Center retrieves the GOMEX box corer from Bellingham Bay, Washington.
USGS marine engineering technician Dan Powers from the USGS Pacific Coastal and Marine Science Center retrieves the GOMEX box corer from Bellingham Bay, Washington.

CTD rosette being deployed
A CTD-rosette is a commonly used instrument that measures conductivity (that can inform scientists about salinity), temperature, and depth (CTD). As the instrument is lowered into the water--sometimes down to great depths--the cylinders around will open at various depths to collect water samples at discrete locations throughout the water column.
A CTD-rosette is a commonly used instrument that measures conductivity (that can inform scientists about salinity), temperature, and depth (CTD). As the instrument is lowered into the water--sometimes down to great depths--the cylinders around will open at various depths to collect water samples at discrete locations throughout the water column.

Caitlin Reynolds with a sediment trap in the Gulf of Mexico
Caitlin Reynolds with a sediment trap in the Gulf of MexicoCaitlin Reynolds of the USGS St. Petersburg Coastal and Marine Science Center secures a sediment trap, retrieved from the bottom of the Gulf of Mexico on board the R/V Pelican.
Caitlin Reynolds with a sediment trap in the Gulf of Mexico
Caitlin Reynolds with a sediment trap in the Gulf of MexicoCaitlin Reynolds of the USGS St. Petersburg Coastal and Marine Science Center secures a sediment trap, retrieved from the bottom of the Gulf of Mexico on board the R/V Pelican.

Sunset on a research vessel in the Gulf of Mexico
A beautiful sun set over the Gulf of Mexico from the stern of the R/V Pelican.
A beautiful sun set over the Gulf of Mexico from the stern of the R/V Pelican.

Retrieving a sediment trap in the Gulf of Mexico
A large winch on the stern of R/V Pelican is used to retrieve two sediment traps from the bottom of the Gulf of Mexico.
A large winch on the stern of R/V Pelican is used to retrieve two sediment traps from the bottom of the Gulf of Mexico.

Porites and Acropora corals in American Samoa
Porites and Acropora coral species in reef flat pools in the National Park of American Samoa on Ofu, Manuʻa Islands Group, American Samoa.
Porites and Acropora coral species in reef flat pools in the National Park of American Samoa on Ofu, Manuʻa Islands Group, American Samoa.

GOMEX box corer
The GOMEX box corer is constructed of stainless steel and is used to sample soft sediments at the bottom of lakes, bays, and the ocean. The GOMEX box coring sampler is so-named because it is popular for sampling work in the Gulf of Mexico.
The GOMEX box corer is constructed of stainless steel and is used to sample soft sediments at the bottom of lakes, bays, and the ocean. The GOMEX box coring sampler is so-named because it is popular for sampling work in the Gulf of Mexico.

Retrieving the GOMEX box corer
PCMSC MarFac field specialists retrieve the GOMEX box corer.
PCMSC MarFac field specialists retrieve the GOMEX box corer.

Divers install monitoring instruments on coral reef
Divers install monitoring instruments on coral reefDive operations with National Park Service and the National Park of American Samoa installing tide, wave, temperature, and salinity sensors on the fore reef in NPSA off the south shore of Ofu, Manuʻa.

Installing a thermal imaging system
USGS scientists install a thermal imaging system in the National Park of American Samoa off the south shore of Ofu, Manua. The system detects temperature variations, like a colder freshwater plume that emanates from the shore.
USGS scientists install a thermal imaging system in the National Park of American Samoa off the south shore of Ofu, Manua. The system detects temperature variations, like a colder freshwater plume that emanates from the shore.

Deploying anchor chain for an oceanographic buoy
USGS researchers Chris Moore and Mitchell Lemon took a trip on the R/V Weatherbird in January of 2020 with the University of South Florida College of Marine Science as part of a study on carbon dioxide in the Gulf of Mexico. Carbon Dioxide, or CO2, is a greenhouse gas that can be absorbed by the ocean.
USGS researchers Chris Moore and Mitchell Lemon took a trip on the R/V Weatherbird in January of 2020 with the University of South Florida College of Marine Science as part of a study on carbon dioxide in the Gulf of Mexico. Carbon Dioxide, or CO2, is a greenhouse gas that can be absorbed by the ocean.

Preparing for a day of sampling on Grizzly Bay
Scientists from the USGS Pacific Coastal and Marine Science Center in their vessel jewell, docked at Belden's Landing Water Access Facility on Montezuma Slough. They are preparing for a day of sampling on Grizzly Bay, where they study how sediment moves through sensitive coastal environments.
Scientists from the USGS Pacific Coastal and Marine Science Center in their vessel jewell, docked at Belden's Landing Water Access Facility on Montezuma Slough. They are preparing for a day of sampling on Grizzly Bay, where they study how sediment moves through sensitive coastal environments.

Preparing the GOMEX on Grizzly Bay
From left to right, USGS scientists Sam McGill, Lucas WinklerPrins, David Hart, Selina Davila Olivera, and Pete Dal Ferro work on Grizzly Bay on the vessel Jewell, to collect sediment samples using the GOMEX box corer.
From left to right, USGS scientists Sam McGill, Lucas WinklerPrins, David Hart, Selina Davila Olivera, and Pete Dal Ferro work on Grizzly Bay on the vessel Jewell, to collect sediment samples using the GOMEX box corer.

Sediment collected in a GOMEX box corer
USGS science crew works to free the muddy sediment from a GOMEX box corer. They are on board the Pacific Coastal and Marine Science Center's vessel Jewell on Grizzly Bay in the San Francisco Bay area.
USGS science crew works to free the muddy sediment from a GOMEX box corer. They are on board the Pacific Coastal and Marine Science Center's vessel Jewell on Grizzly Bay in the San Francisco Bay area.

Grizzly Bay dolphin with weather station installed on top
Grizzly Bay dolphin with weather station installed on topA structure called a dolphin, permanently affixed in the sediment, stands in Grizzly Bay near San Francisco, CA, with a weather station installed on top. The USGS will use the data from the weather station in conjunction with other oceanographic data, in their studies of sediment movement in the bay.

Sampling on Grizzly Bay
On PCMSC vessel Jewell, a team of USGS scientists sit in Grizzly Bay, a baylet of San Francisco Bay in Solano County, California. USGS collects sediment samples to study how sediment moves through sensitive coastal environments like this.
On PCMSC vessel Jewell, a team of USGS scientists sit in Grizzly Bay, a baylet of San Francisco Bay in Solano County, California. USGS collects sediment samples to study how sediment moves through sensitive coastal environments like this.