Successful experimental elkhorn coral colony in Dry Tortugas National Park
Successful experimental elkhorn coral colony in Dry Tortugas National ParkThe U.S.

Official websites use .gov
A .gov website belongs to an official government organization in the United States.
Secure .gov websites use HTTPS
A lock () or https:// means you’ve safely connected to the .gov website. Share sensitive information only on official, secure websites.
Coastal and Marine Hazards and Resources Program images.

The U.S.

The U.S. Geological Survey is conducting research to guide the restoration and recovery of threatened corals in Dry Tortugas National Park and throughout the western Atlantic. Shown here are two colonies of the threatened elkhorn coral, Acropora palmata, with a colony of staghorn coral, Acropora cervicornis, in the center.
The U.S. Geological Survey is conducting research to guide the restoration and recovery of threatened corals in Dry Tortugas National Park and throughout the western Atlantic. Shown here are two colonies of the threatened elkhorn coral, Acropora palmata, with a colony of staghorn coral, Acropora cervicornis, in the center.

The U.S. Geological Survey is conducting research to guide the restoration and recovery of threatened corals in Dry Tortugas National Park and throughout the western Atlantic. Shown here is a colony of the threatened elkhorn coral, Acropora palmata, that has grown over the sides of a cinderblock experimental platform.
The U.S. Geological Survey is conducting research to guide the restoration and recovery of threatened corals in Dry Tortugas National Park and throughout the western Atlantic. Shown here is a colony of the threatened elkhorn coral, Acropora palmata, that has grown over the sides of a cinderblock experimental platform.

A vibracore being deployed by USGS staff from the FSU R/V Apalachee for the Naval Research Laboratory (NRL). The objective of this field effort was to establish a baseline environmental characterization for a test bed to predict mobility and burial of unexploded ordnance (UXO) in response to waves and currents.
A vibracore being deployed by USGS staff from the FSU R/V Apalachee for the Naval Research Laboratory (NRL). The objective of this field effort was to establish a baseline environmental characterization for a test bed to predict mobility and burial of unexploded ordnance (UXO) in response to waves and currents.
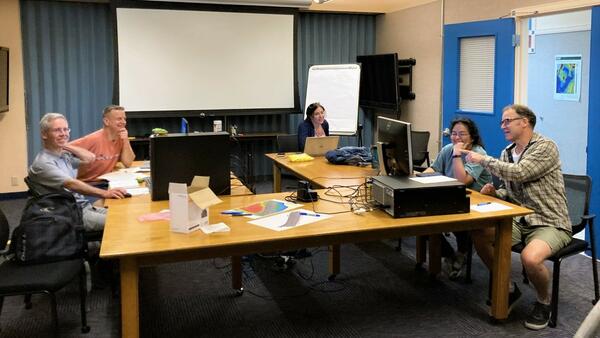
The USGS Processes Impacting Seafloor Change and Ecosystem Services (PISCES) project team meeting at the St. Petersburg Coastal and Marine Science Center in May 2022 to coordinate Structure-from-motion (SfM) Quantitative Underwater Imaging Device with 5 cameras (SQUID-5) and diver-based SfM data acquisition and processing for field work.
The USGS Processes Impacting Seafloor Change and Ecosystem Services (PISCES) project team meeting at the St. Petersburg Coastal and Marine Science Center in May 2022 to coordinate Structure-from-motion (SfM) Quantitative Underwater Imaging Device with 5 cameras (SQUID-5) and diver-based SfM data acquisition and processing for field work.

Caitlin Reynolds retrieving one of the sediment traps used by USGS to study sediment flux in the Gulf of America on board the Research Vessel (R/V) Weatherbird II (Florida Institute of Oceanography).
Caitlin Reynolds retrieving one of the sediment traps used by USGS to study sediment flux in the Gulf of America on board the Research Vessel (R/V) Weatherbird II (Florida Institute of Oceanography).

Eckerd College students taking water samples from a CTD-rosette on board the R/V Weatherbird
Eckerd College students taking water samples from a CTD-rosette on board the R/V Weatherbird

Our coasts, the most familiar part of the ocean are the gateway to the larger deeper ocean world. USGS studies processes and hazards in the coastal zone and how they affect people, wildlife, and ecosystems.
Our coasts, the most familiar part of the ocean are the gateway to the larger deeper ocean world. USGS studies processes and hazards in the coastal zone and how they affect people, wildlife, and ecosystems.

An erosion model activity used by the St. Petersburg Coastal and Marine Science Center to showcase how hurricane-force winds can cause damage to coastal environments.
An erosion model activity used by the St. Petersburg Coastal and Marine Science Center to showcase how hurricane-force winds can cause damage to coastal environments.

The SQUID-5, or Structure-from-motion (SfM) Quantitative Underwater Imaging Device with 5 cameras test in Tampa Bay.
The SQUID-5, or Structure-from-motion (SfM) Quantitative Underwater Imaging Device with 5 cameras test in Tampa Bay.

The SQUID-5, or Structure-from-motion (SfM) Quantitative Underwater Imaging Device with 5 cameras, being deployed by Mitch Lemon (SPCMSC, on the left) and Gerry Hatcher (PCMSC, on the right) in Tampa Bay for testing.
The SQUID-5, or Structure-from-motion (SfM) Quantitative Underwater Imaging Device with 5 cameras, being deployed by Mitch Lemon (SPCMSC, on the left) and Gerry Hatcher (PCMSC, on the right) in Tampa Bay for testing.

Dr. Legna Torres-García conducts an erosion model activity at the LCC Day School in St. Petersburg, FL, to showcase how hurricane-force winds can cause damage to coastal environments.
Dr. Legna Torres-García conducts an erosion model activity at the LCC Day School in St. Petersburg, FL, to showcase how hurricane-force winds can cause damage to coastal environments.

The SQUID-5, or Structure-from-motion (SfM) Quantitative Underwater Imaging Device with 5 cameras, shown being staged for a test run at the St. Petersburg Coastal and Marine Science Center. In the background, Andy Farmer (SPCMSC) and Gerry Hatcher (PCMSC) prep the R/V Sallenger, the vessel being used to tow the device.
The SQUID-5, or Structure-from-motion (SfM) Quantitative Underwater Imaging Device with 5 cameras, shown being staged for a test run at the St. Petersburg Coastal and Marine Science Center. In the background, Andy Farmer (SPCMSC) and Gerry Hatcher (PCMSC) prep the R/V Sallenger, the vessel being used to tow the device.

The R/V Weatherbird II docked at the Florida Institute of Oceanography at University of South Florida (USF) College of Marine Science in St. Petersburg, Florida. USGS scientists and partners at Eckerd College and USF load the vessel in preparation for a research cruise as part of a National Science Foundation (NSF)-funded Scientists-at-Sea program.
The R/V Weatherbird II docked at the Florida Institute of Oceanography at University of South Florida (USF) College of Marine Science in St. Petersburg, Florida. USGS scientists and partners at Eckerd College and USF load the vessel in preparation for a research cruise as part of a National Science Foundation (NSF)-funded Scientists-at-Sea program.

Trayectorias de los huracanes Hugo (1989), Georges (1998), Irma (2017) y María (2017). Datos provistos por la NOAA. La imagen de base es propiedad intelectual de Esri y se usa aquí bajo licencia. Los derechos de autor y reproducción son propiedad de Esri y sus licenciatarios.
Trayectorias de los huracanes Hugo (1989), Georges (1998), Irma (2017) y María (2017). Datos provistos por la NOAA. La imagen de base es propiedad intelectual de Esri y se usa aquí bajo licencia. Los derechos de autor y reproducción son propiedad de Esri y sus licenciatarios.

Idealized animation of tsunamis produced by the 15 January 2022 eruption of Hunga Tonga-Hunga Ha‛apai volcano in the Kingdom of Tonga. View to the southeast.
Idealized animation of tsunamis produced by the 15 January 2022 eruption of Hunga Tonga-Hunga Ha‛apai volcano in the Kingdom of Tonga. View to the southeast.

Screenshot of an idealized animation of tsunamis produced by the 15 January 2022 eruption of Hunga Tonga-Hunga Haʻapai volcano in the Kingdom of Tonga. View to the north-northeast. The fastest water wave to radiate away from the eruption is being pushed by an atmospheric wave triggered by the explosion.
Screenshot of an idealized animation of tsunamis produced by the 15 January 2022 eruption of Hunga Tonga-Hunga Haʻapai volcano in the Kingdom of Tonga. View to the north-northeast. The fastest water wave to radiate away from the eruption is being pushed by an atmospheric wave triggered by the explosion.
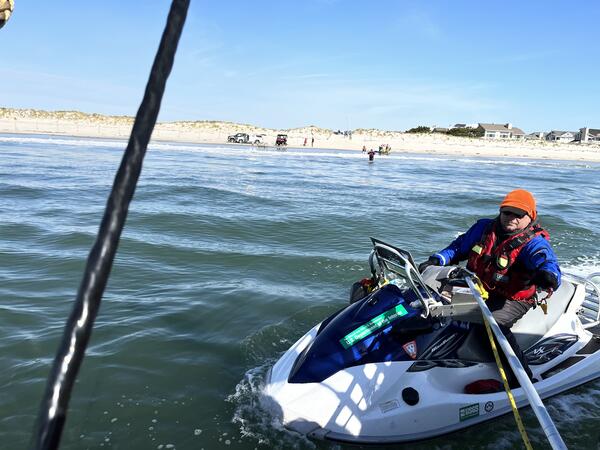
BJ Reynolds of the St. Petersburg Coastal and Marine Science Center operates a personal watercraft near the shoreline of Seven Mile Island, New Jersey. This vessel is used to collect single beam bathymetry (depth and seafloor shape) in the nearshore, and the equipment on the shoreline is used to collect chirp seismic reflection on the shoreface and inner shelf.
BJ Reynolds of the St. Petersburg Coastal and Marine Science Center operates a personal watercraft near the shoreline of Seven Mile Island, New Jersey. This vessel is used to collect single beam bathymetry (depth and seafloor shape) in the nearshore, and the equipment on the shoreline is used to collect chirp seismic reflection on the shoreface and inner shelf.

The USGS Coastal Change Hazards Portal contains an interactive map of historical shoreline positions and shoreline change rates for Puerto Rico.
The USGS Coastal Change Hazards Portal contains an interactive map of historical shoreline positions and shoreline change rates for Puerto Rico.

Idealized animation of tsunamis produced by the 15 January 2022 eruption of Hunga Tonga-Hunga Ha‛apai volcano in the Kingdom of Tonga. View to the north-northeast.
Idealized animation of tsunamis produced by the 15 January 2022 eruption of Hunga Tonga-Hunga Ha‛apai volcano in the Kingdom of Tonga. View to the north-northeast.

Photograph collage representing different coastlines; permafrost coasts, sandy beaches, rocky beaches, wetlands and marshes, cliff-backed beaches, and estuaries.
Photograph collage representing different coastlines; permafrost coasts, sandy beaches, rocky beaches, wetlands and marshes, cliff-backed beaches, and estuaries.